

Easier access to analytics in ClickView
Published on 3 min read
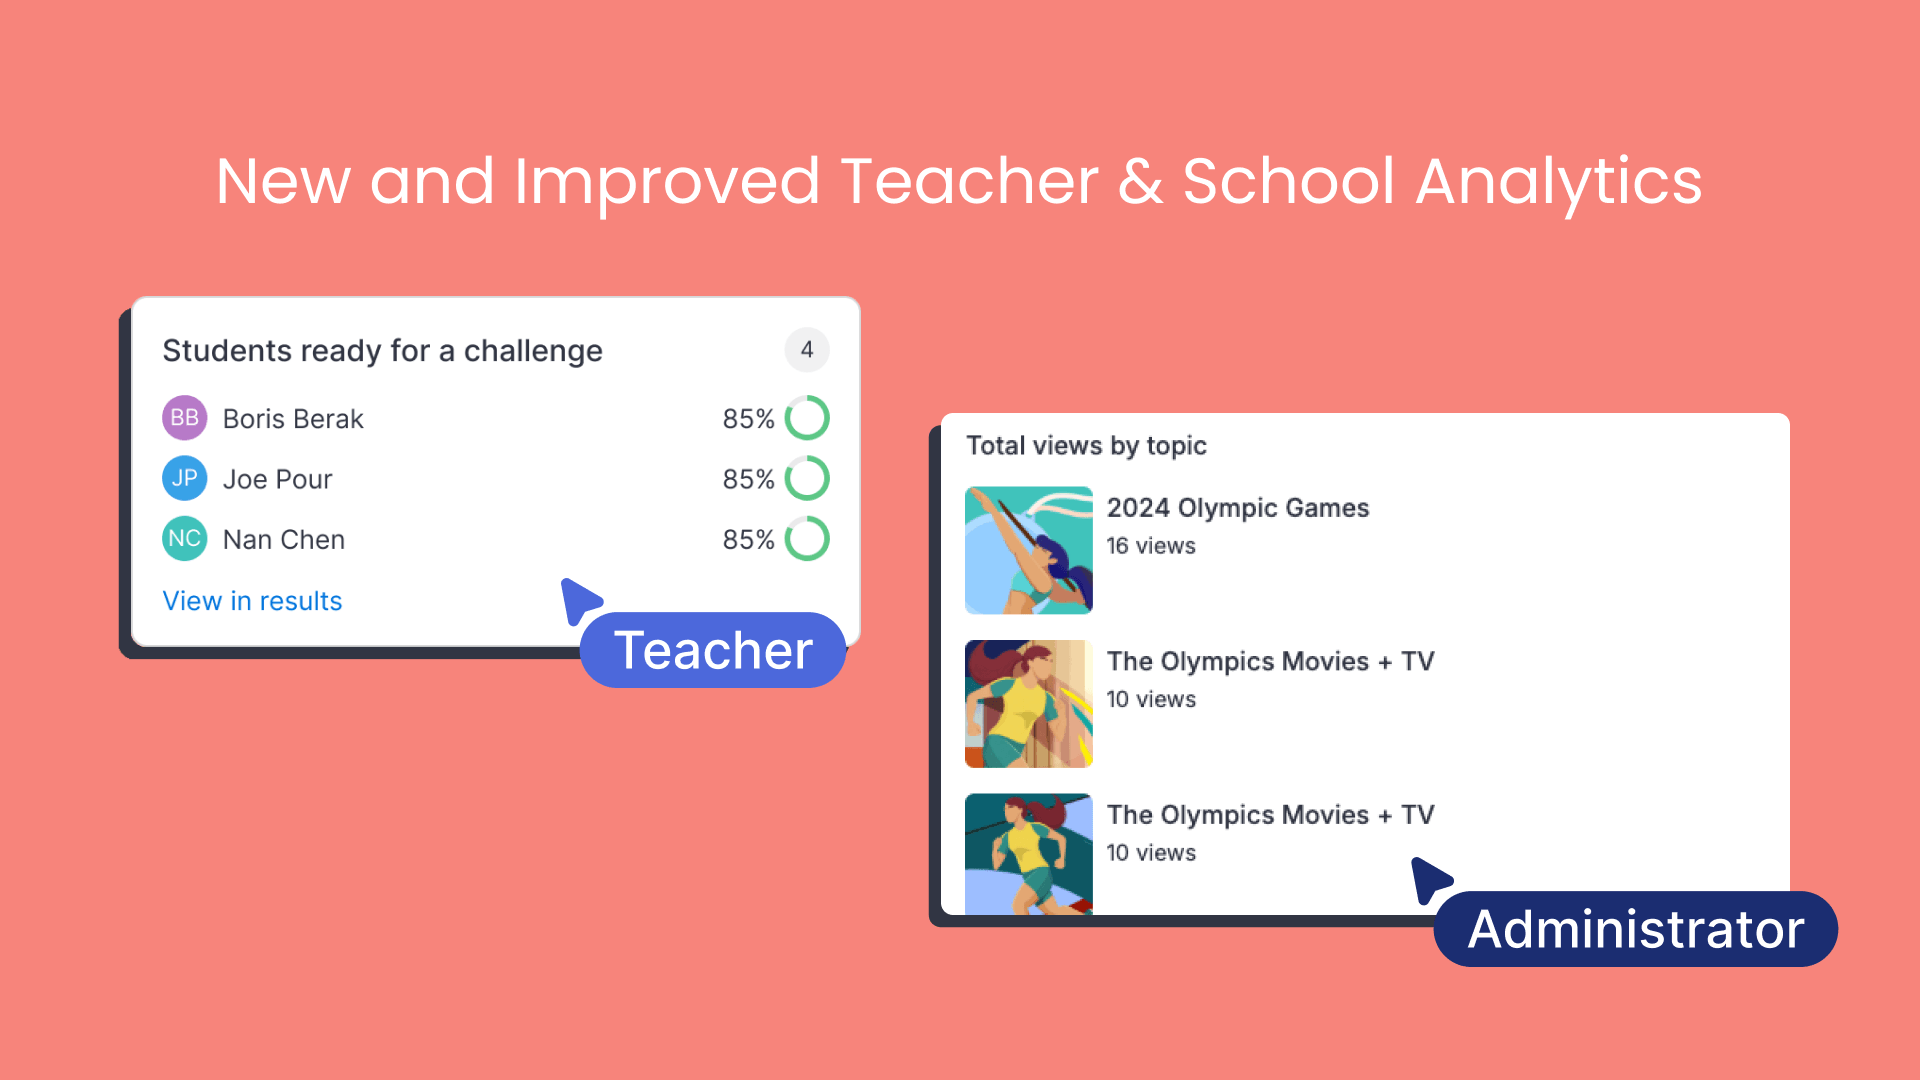
We’ve made some updates to ClickView’s Analytics for Administrators and Teachers, so it’s easier to see how students are engaging with videos.
What’s new
- Teacher analytics — No need to open a new tab. Teachers can now view student activity and quiz results directly from ClickView.
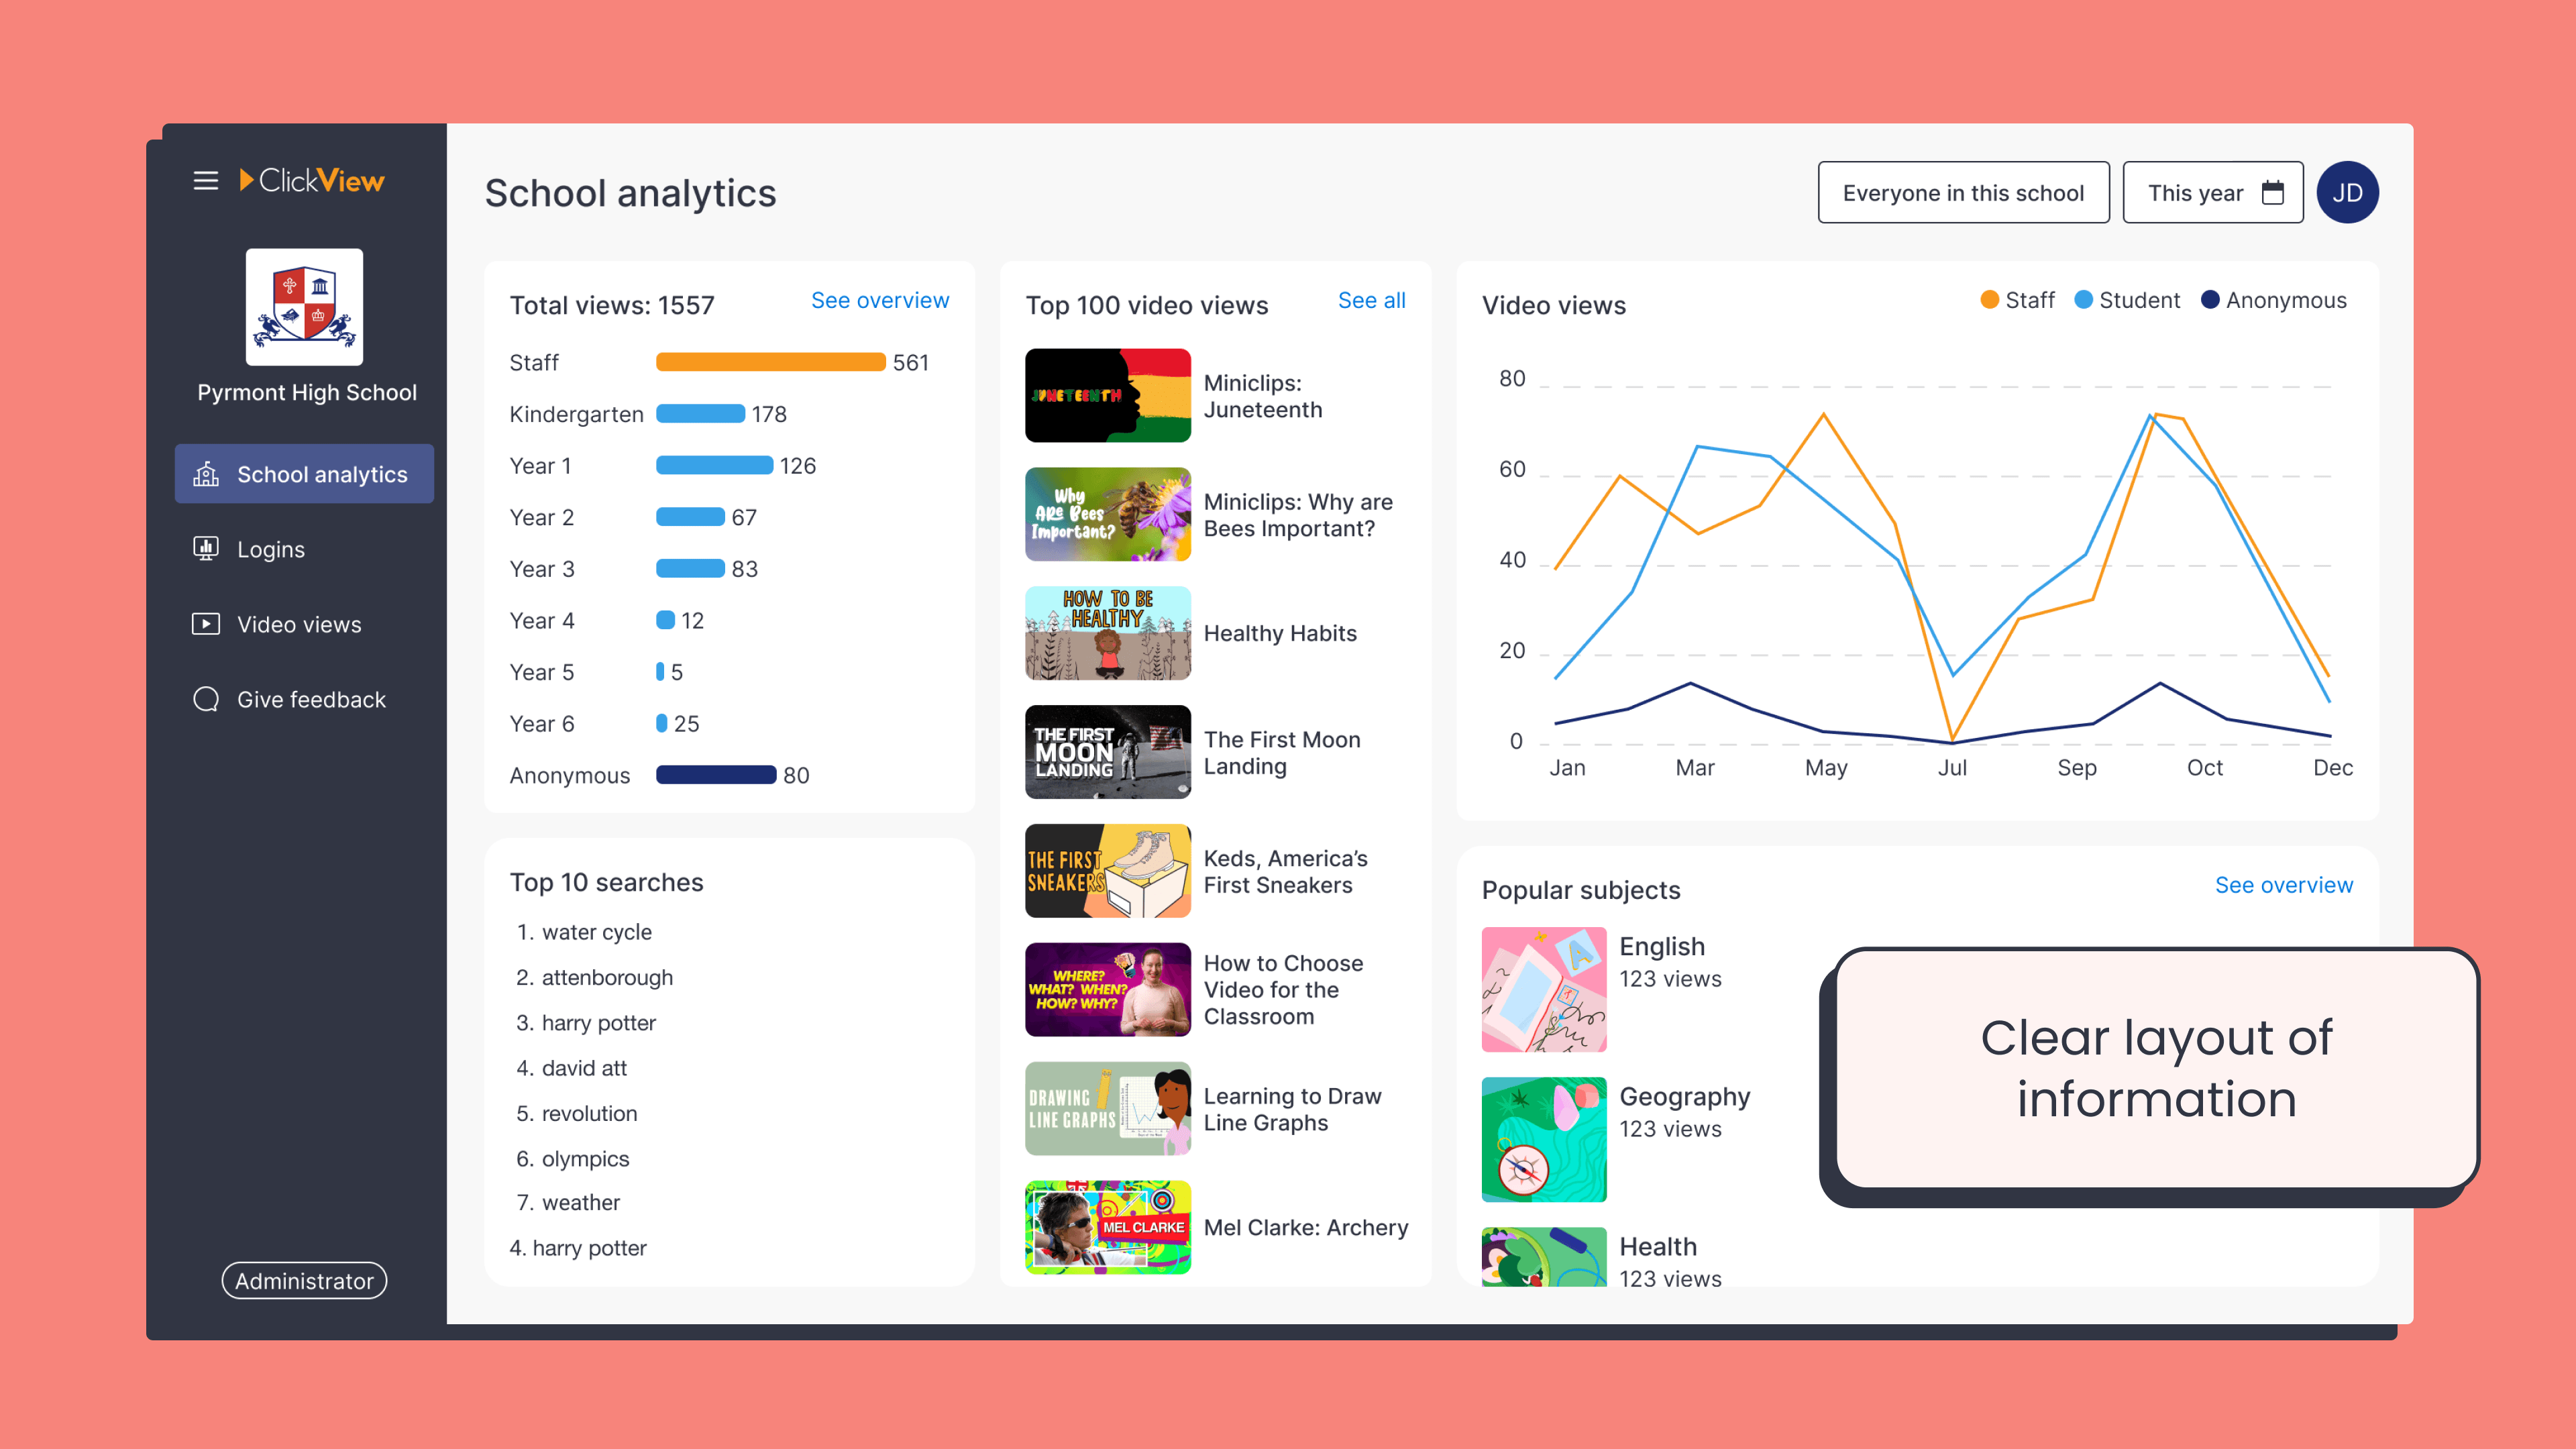
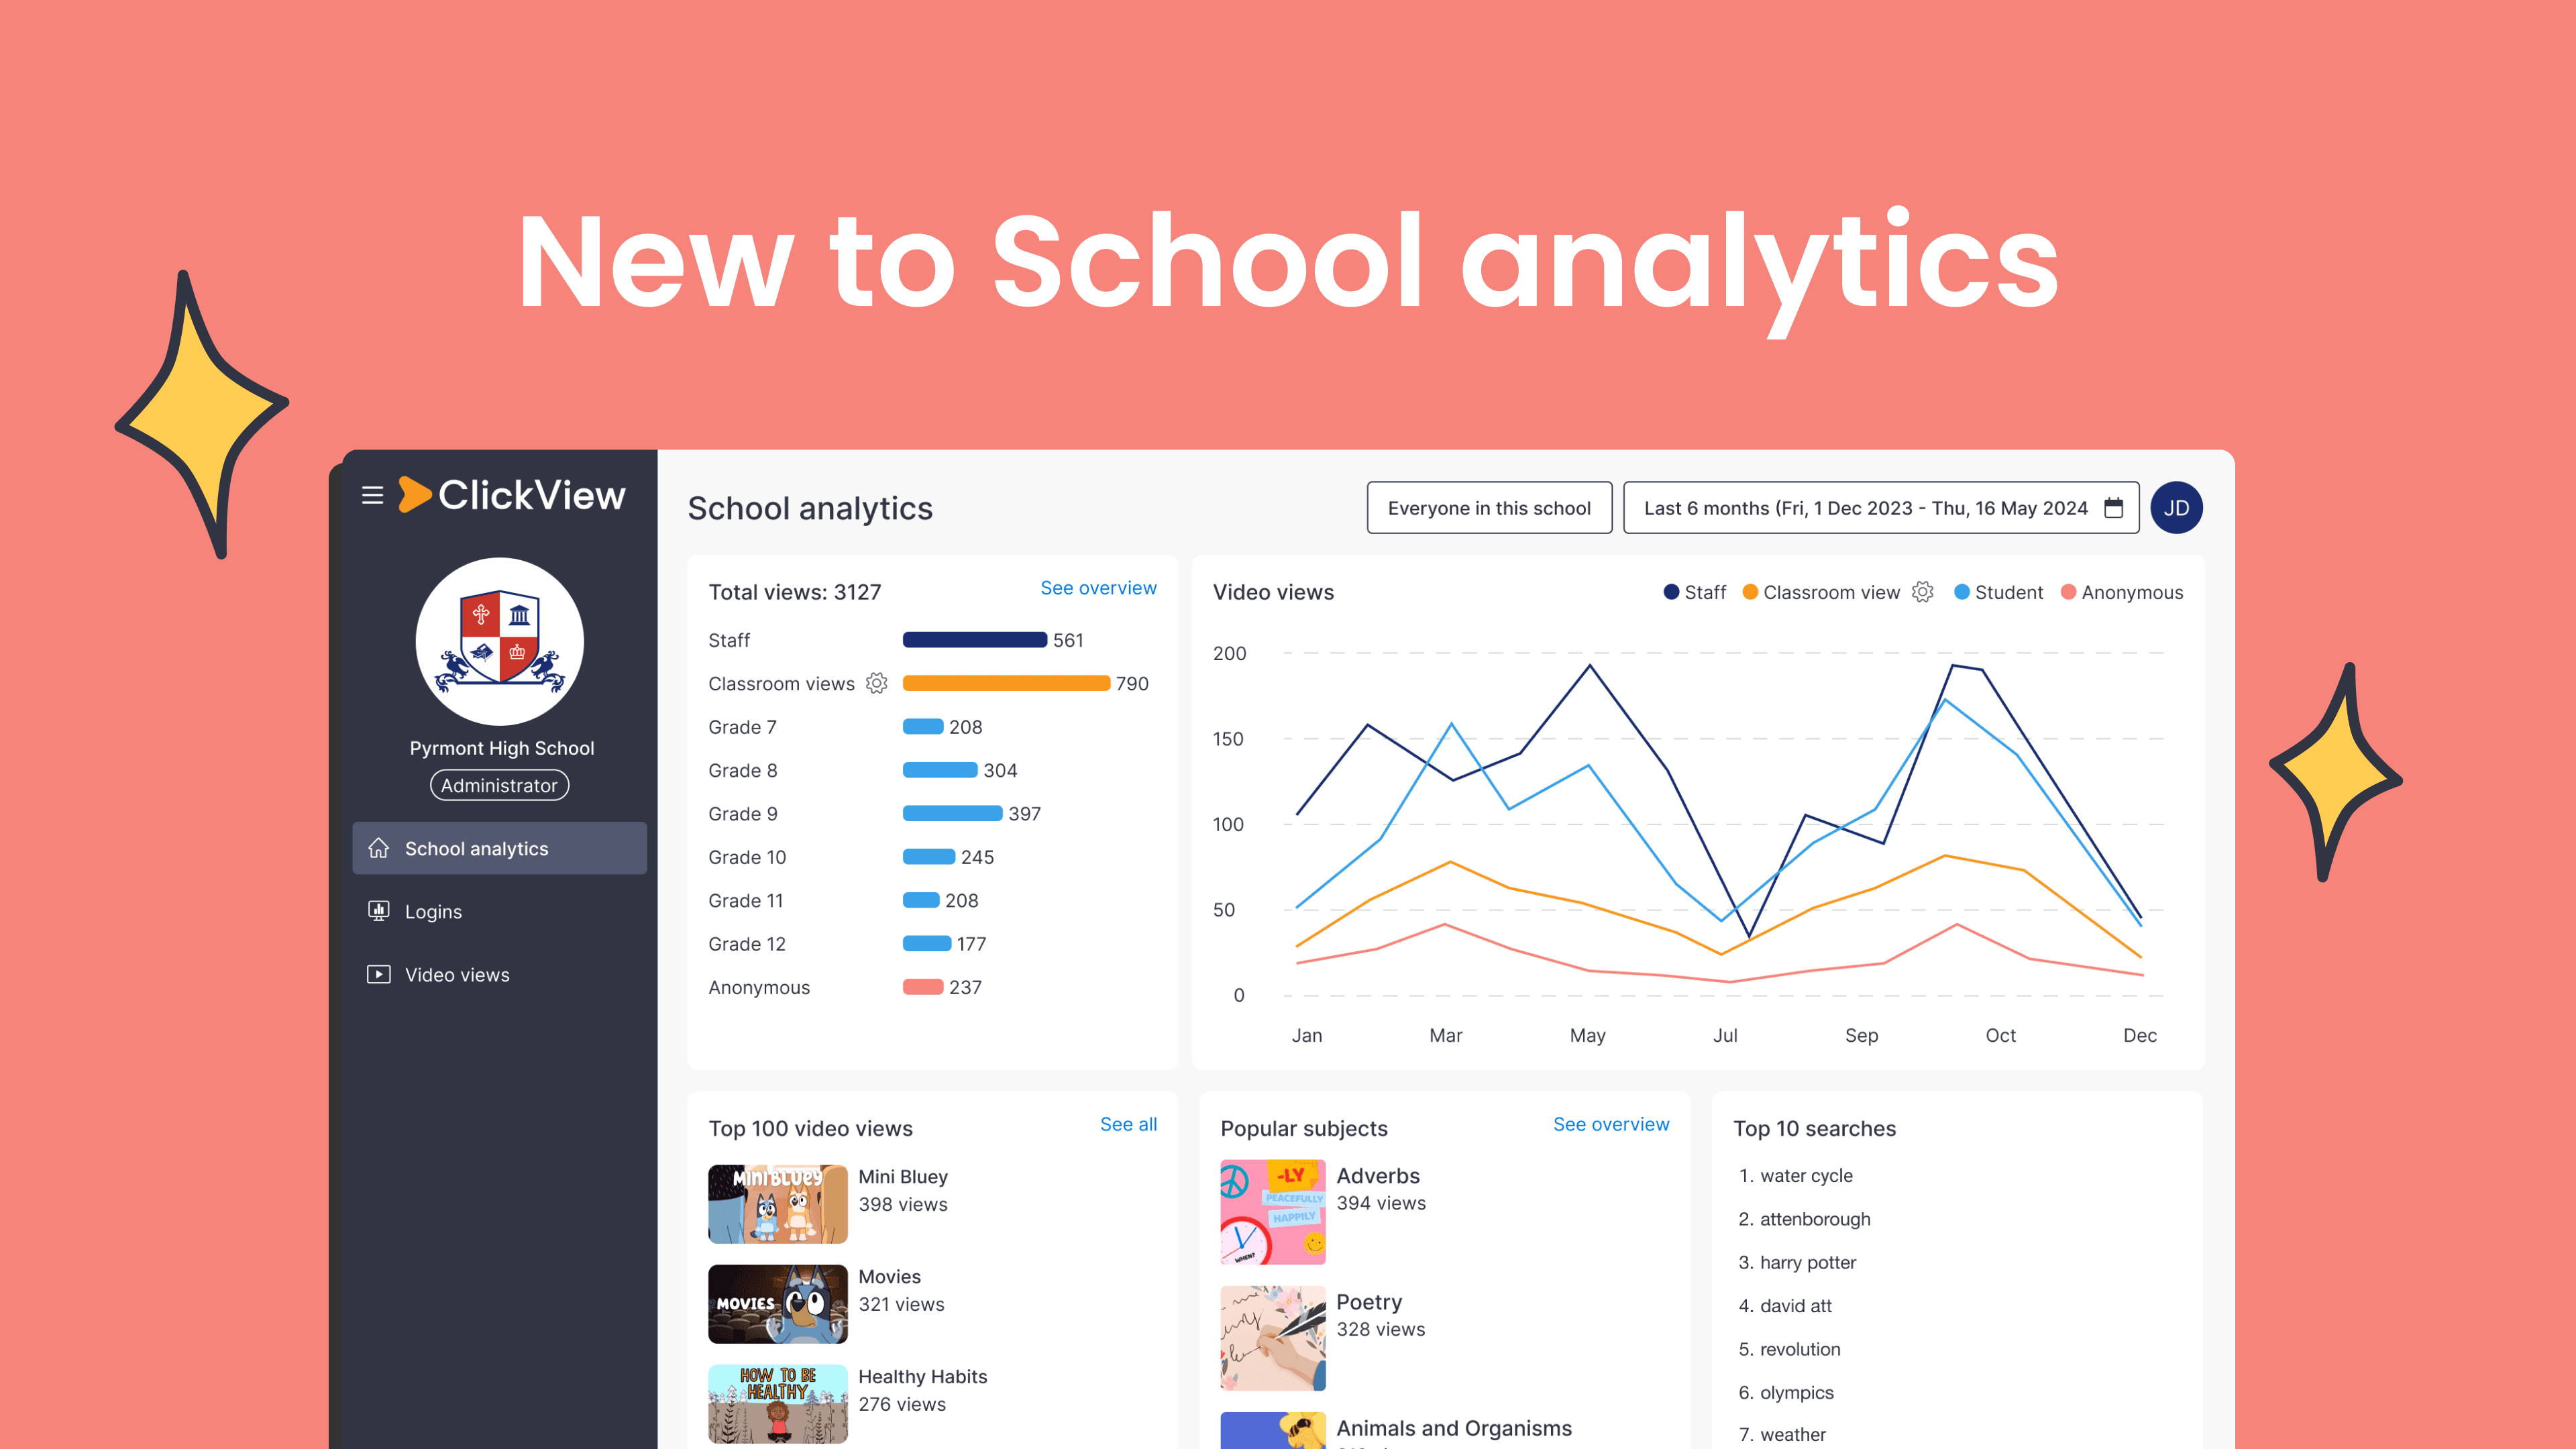
- School analytics — Cleaner visuals and simplified layouts, designed for school-level reporting.
Research & user feedback
These updates were shaped by feedback from teachers globally. Many generously contributed their time during our research and design testing to help us understand what wasn’t working and what could be improved.
Making teacher access easier
A common frustration we heard from teachers was having to open a separate tab just to view student Analytics. Many shared suggestions on how this experience could be made simpler and more useful.
I usually have a lot of tabs open. Sometimes I would do something else and then forget which tab… have to click through to find it again.
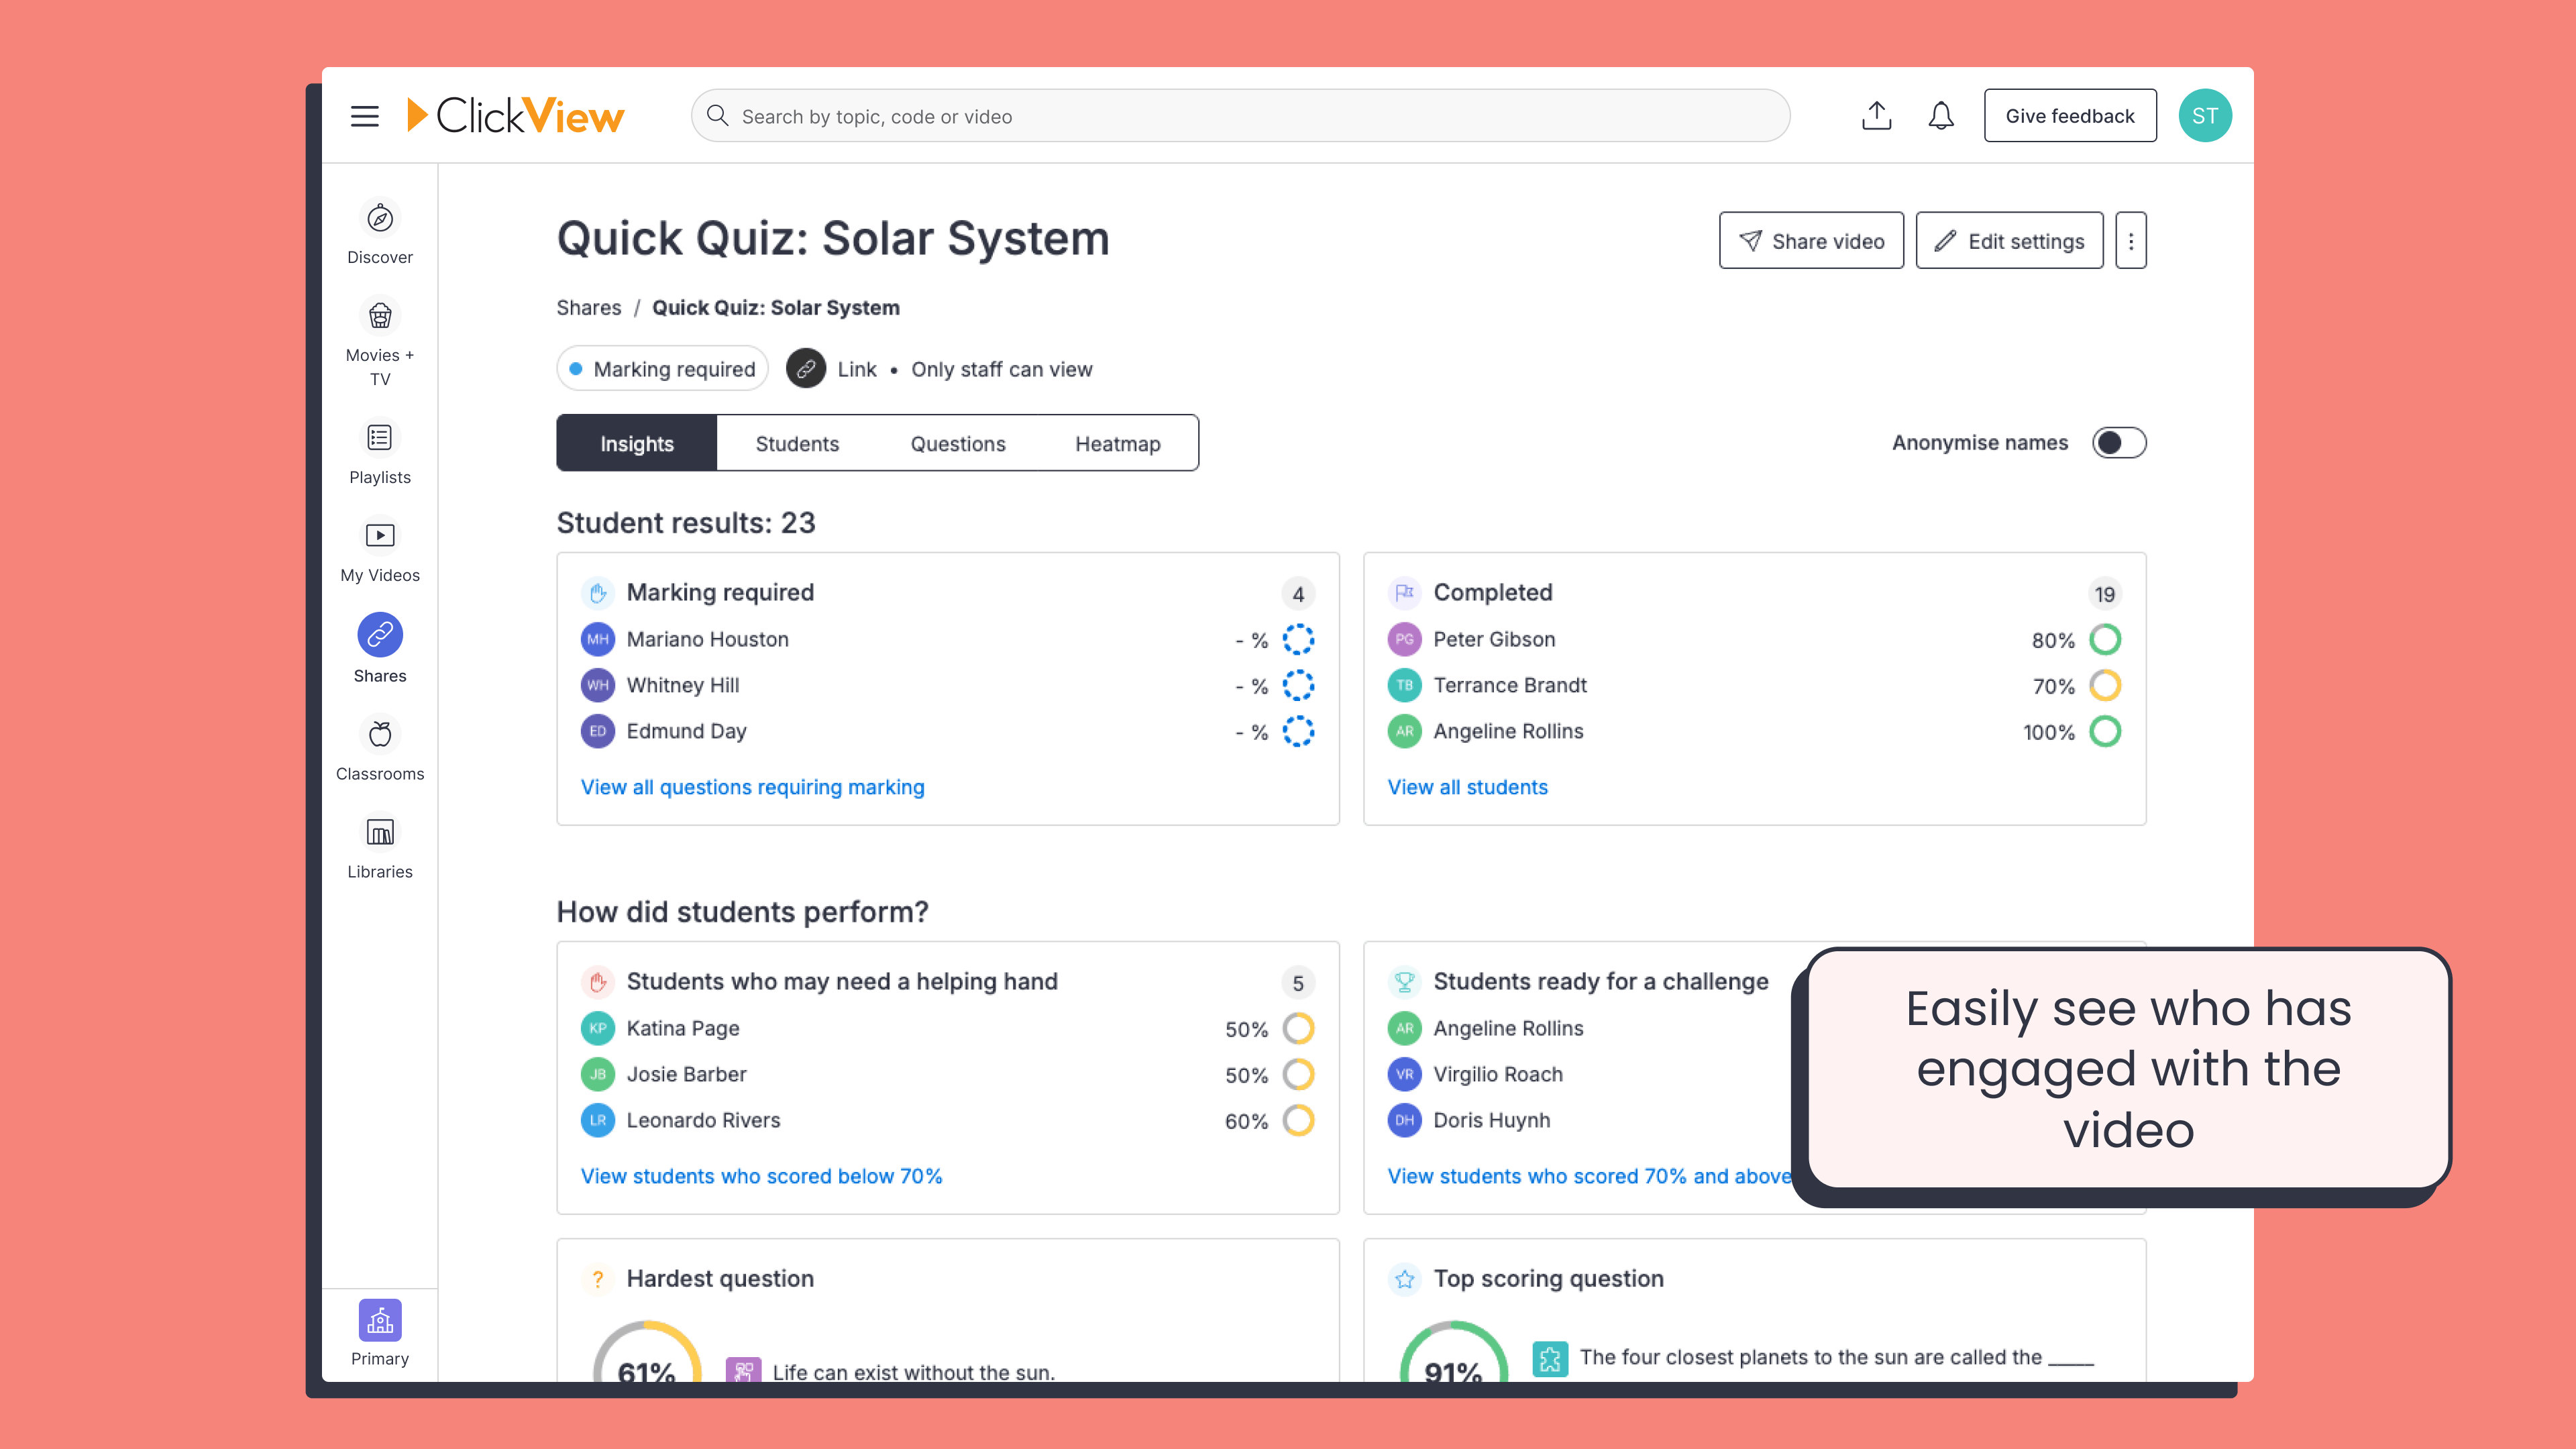
(When viewing student analytics) I want to be able to see who has watched or completed a video first and who hasn’t.
Based on this feedback, we’ve brought teacher analytics directly into ClickView and redesigned the layout to show the insights teachers care about most.
School analytics updated
With teacher analytics now built into ClickView, the standalone ‘Analytics’ section is now focused on school-level reporting. Visuals and layouts have been refreshed to better support Administrators in monitoring overall usage.
What’s changed
How teachers can access their analytics
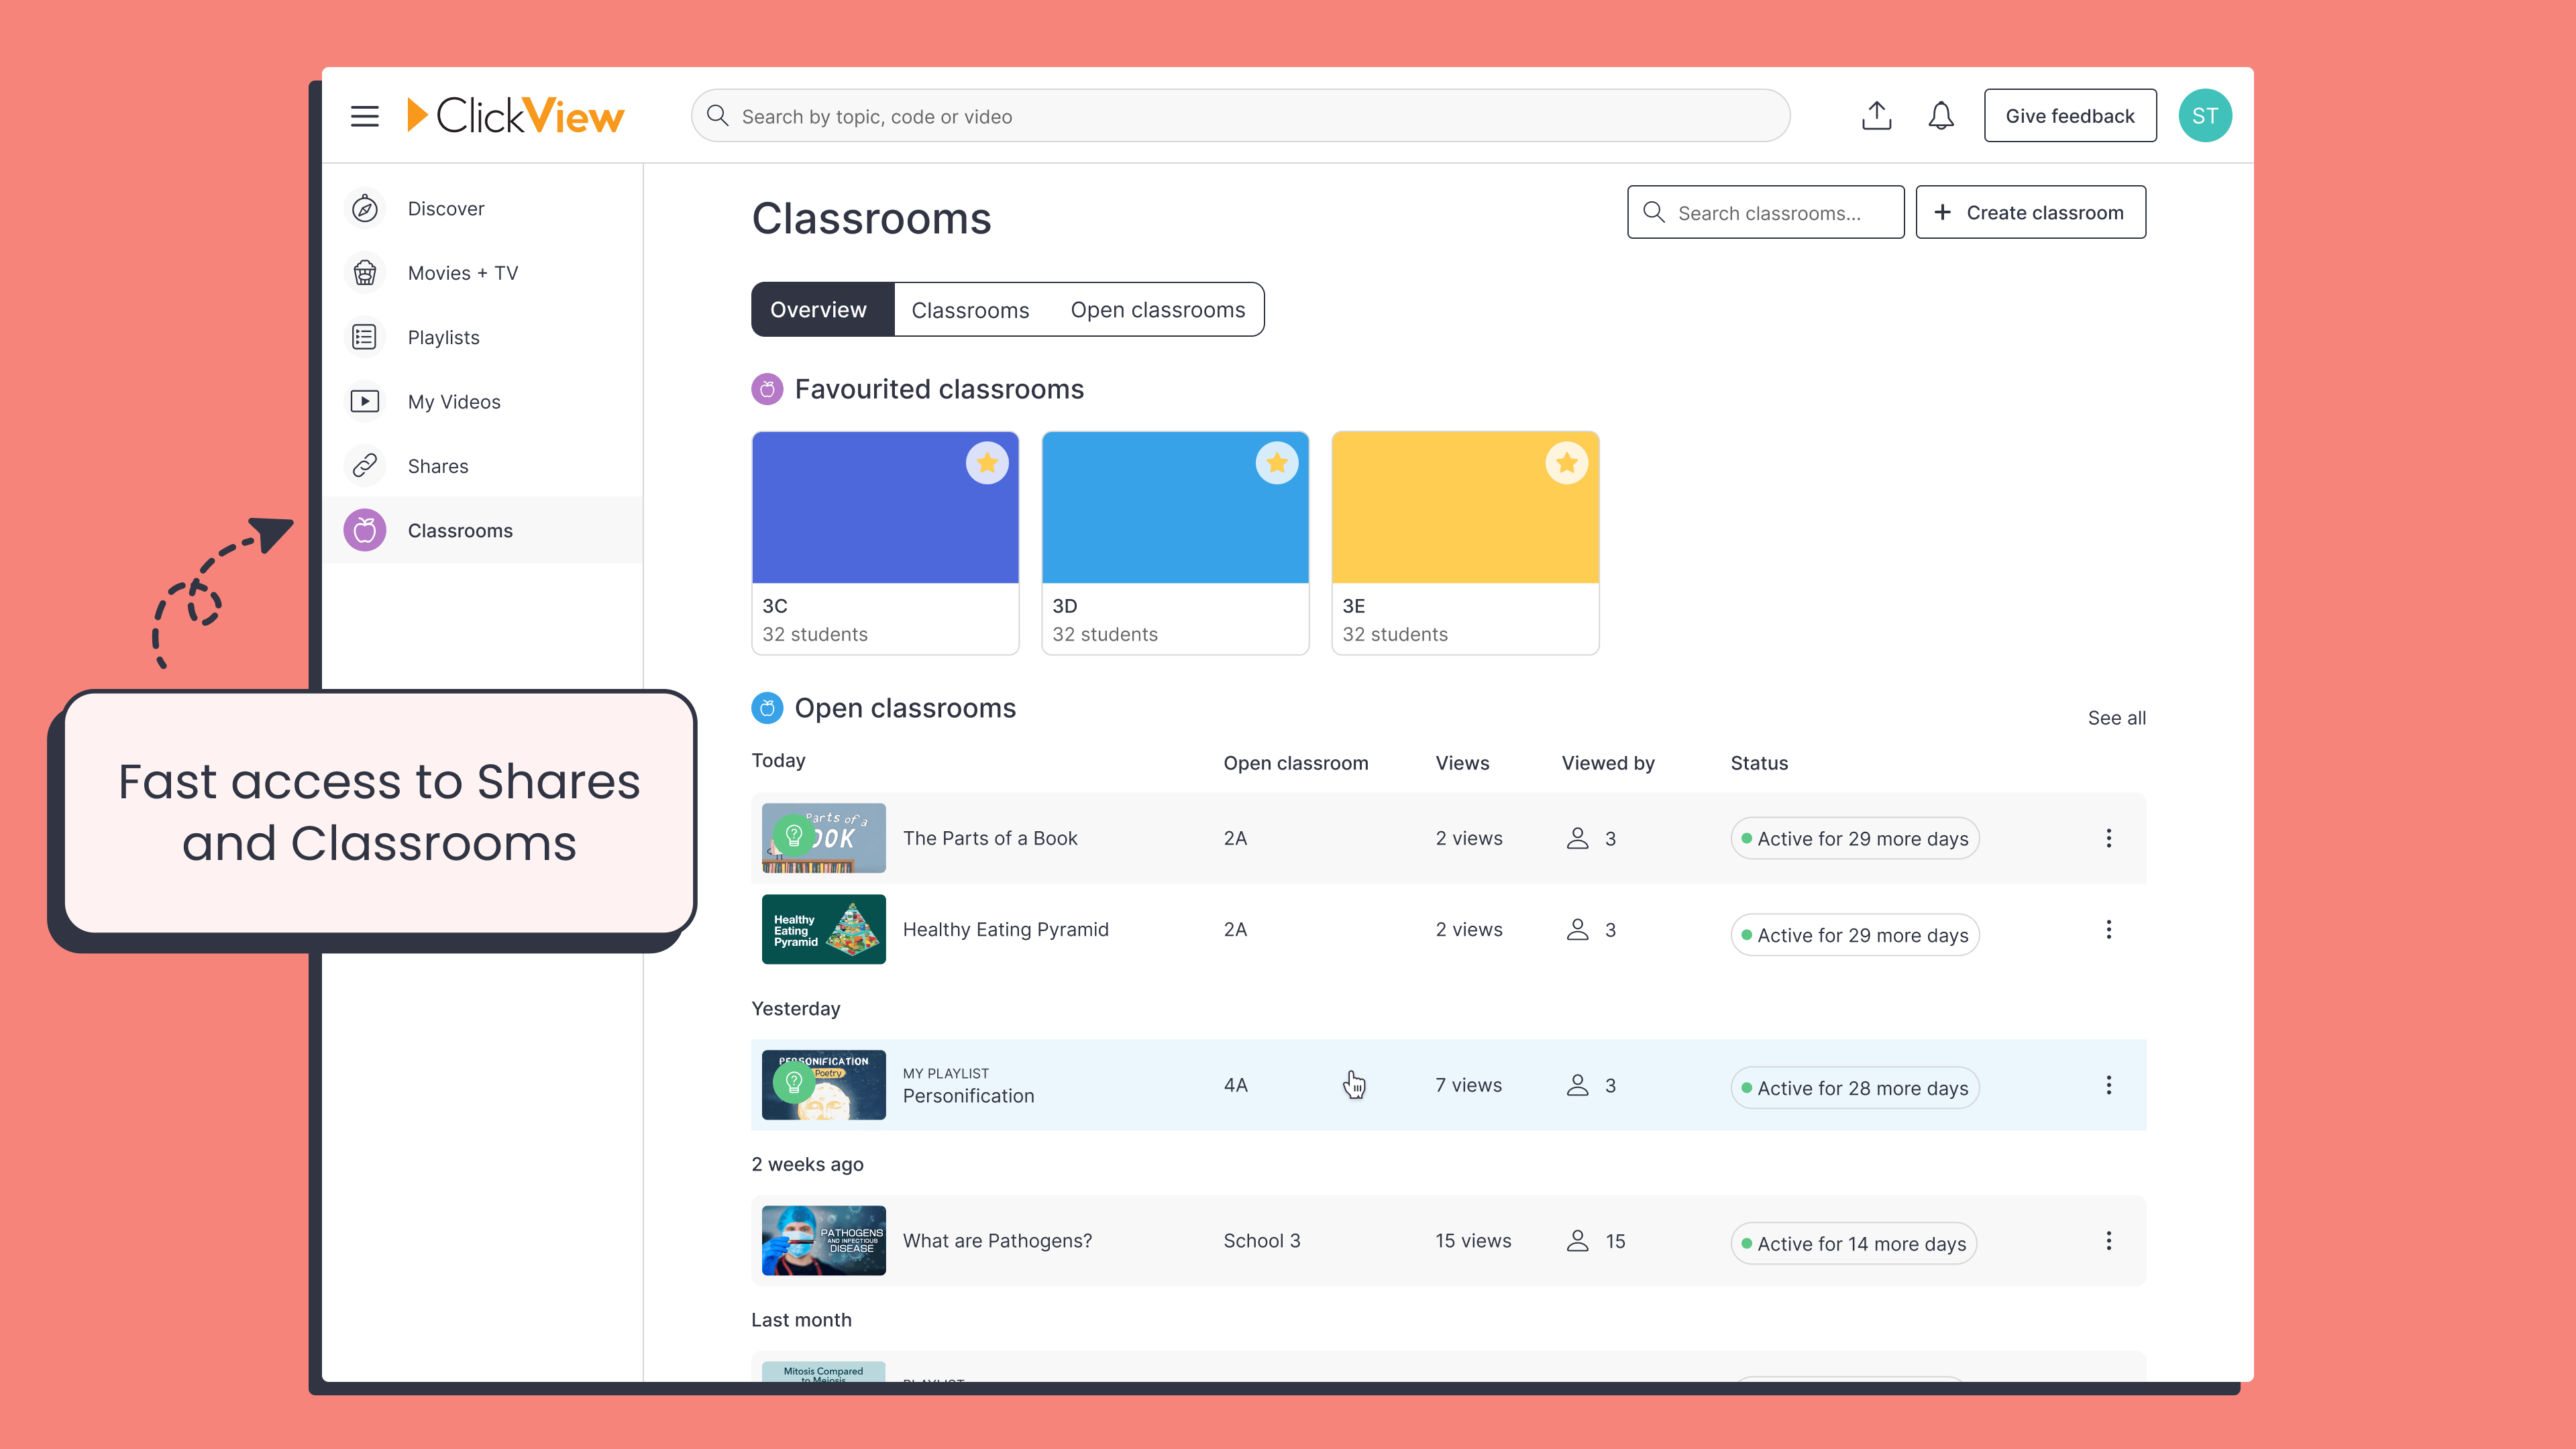
There are now several ways a teacher can get to their analytics:
- Viewing created share links in “Shares”
- Viewing the assigned video in Classrooms
- Open classrooms or
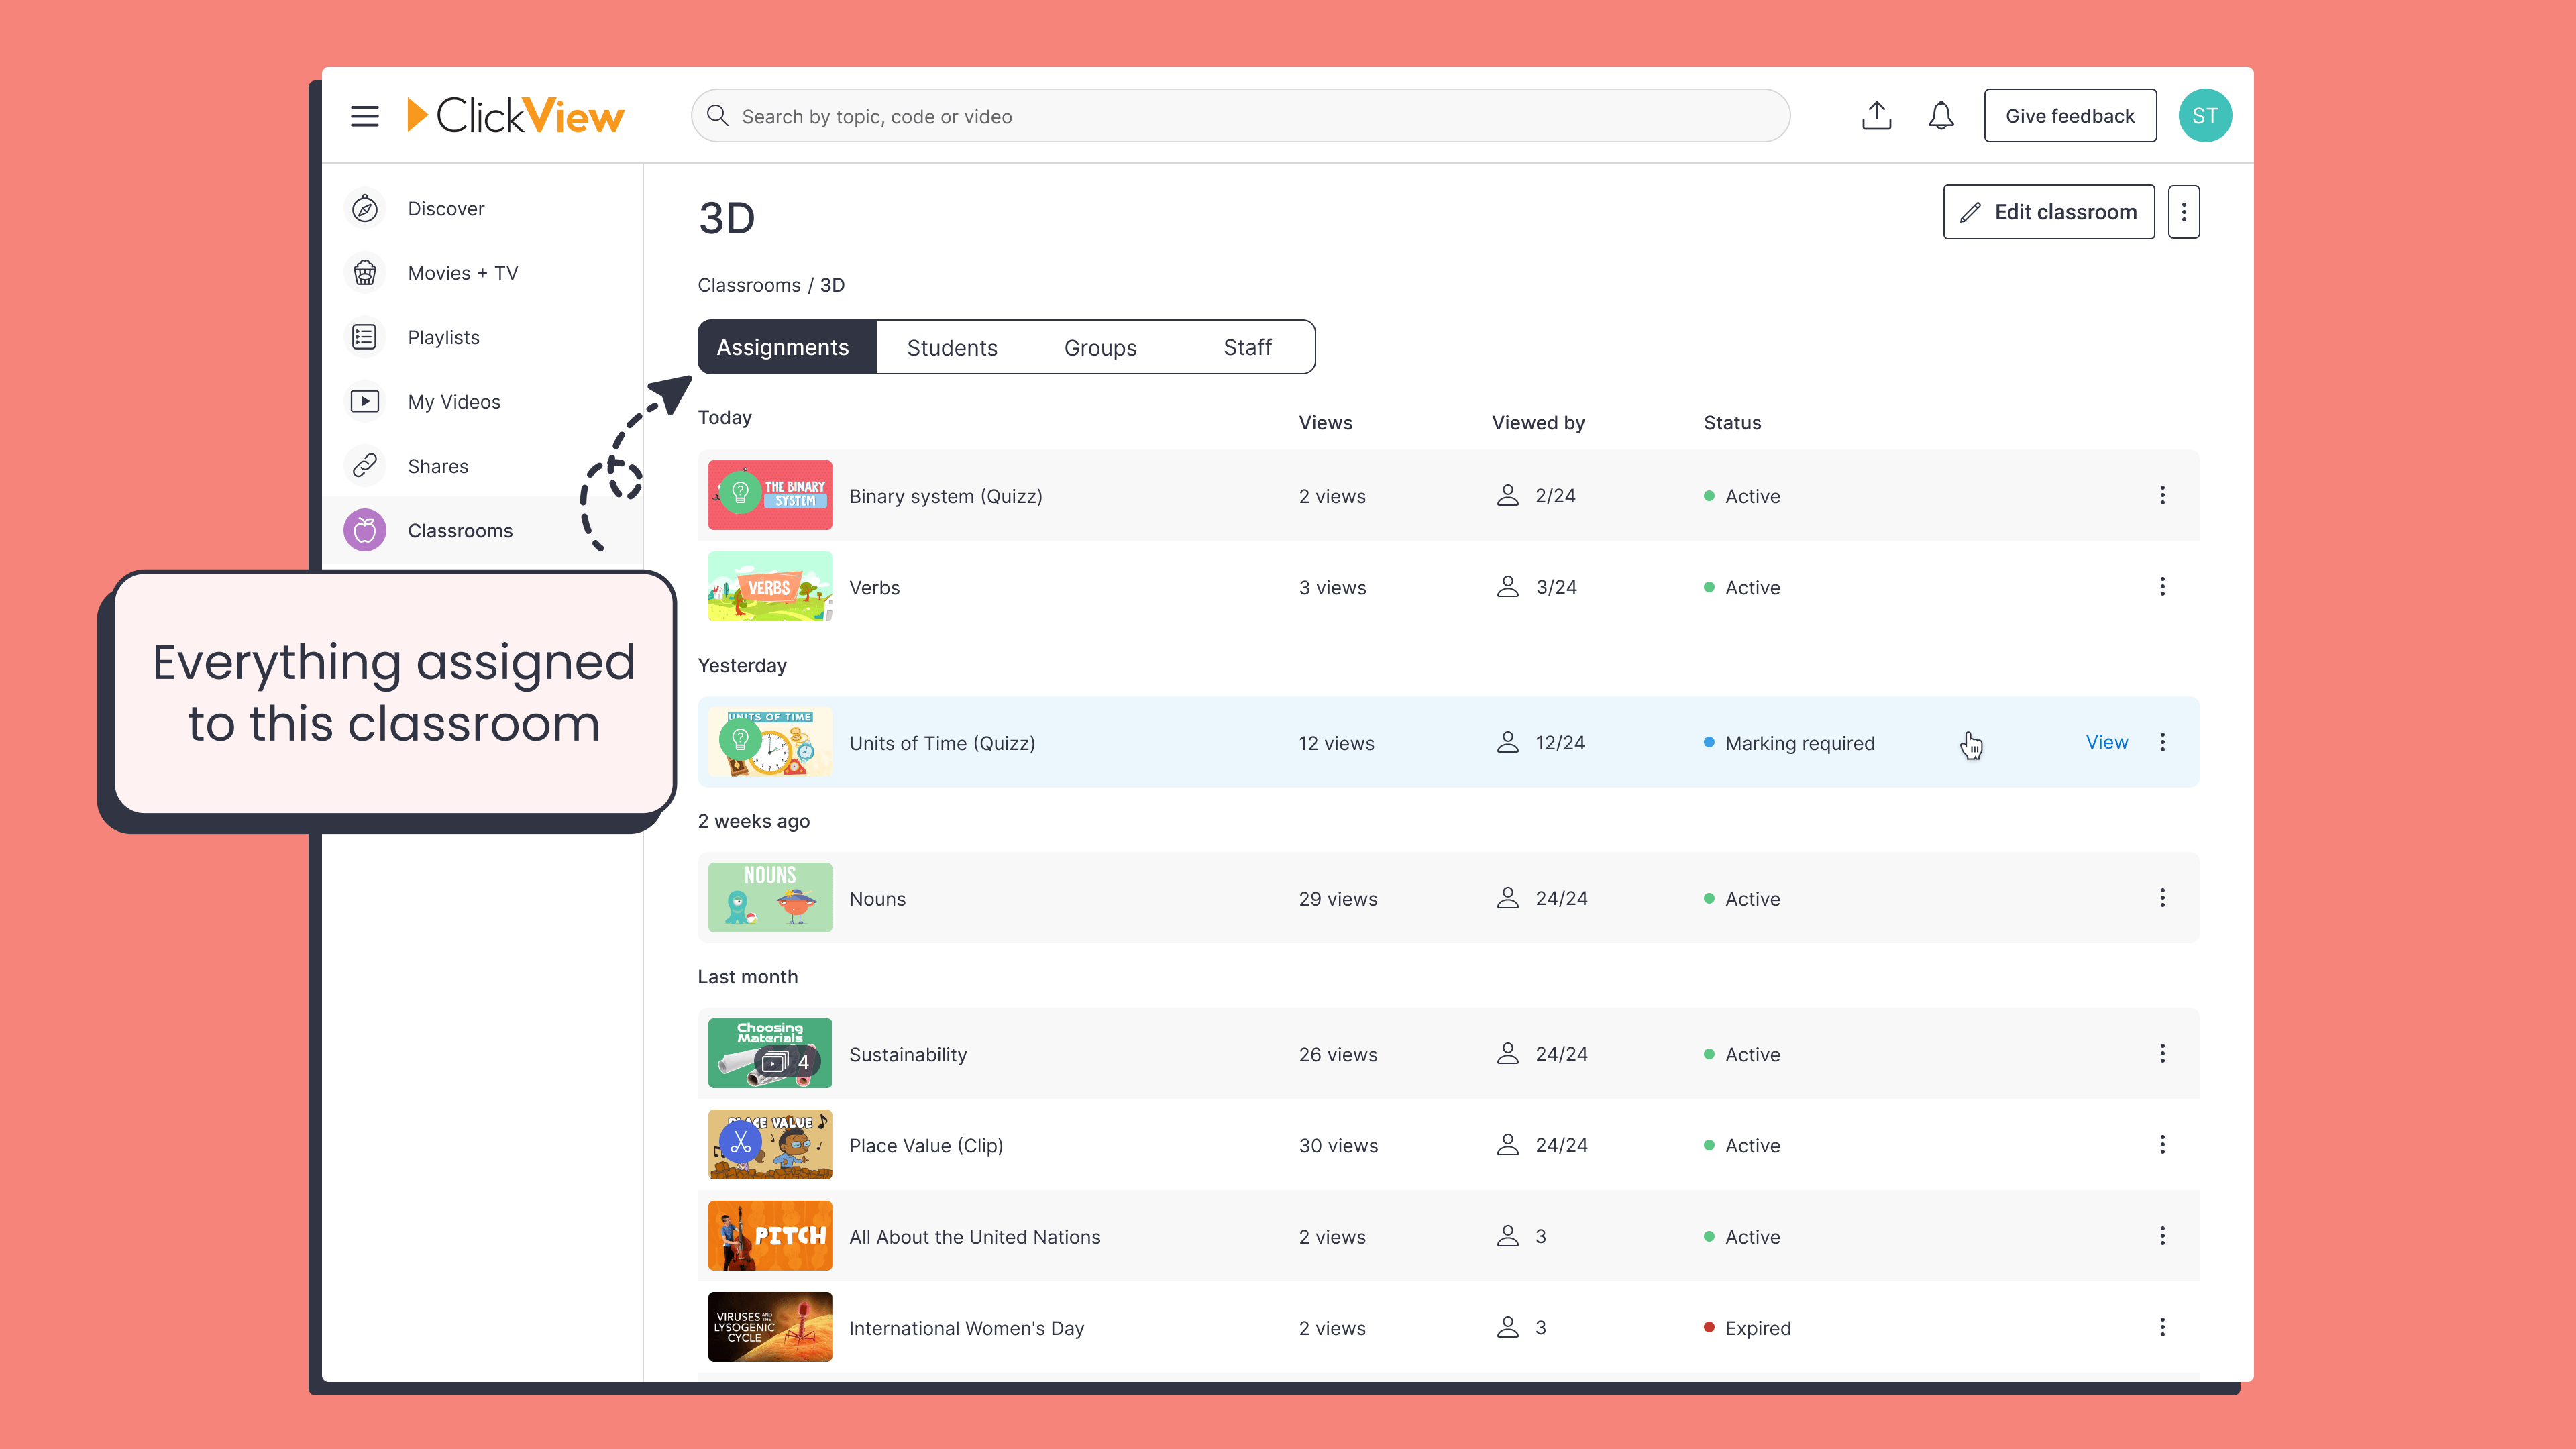
- under the assigned classroom’s “Assignments”
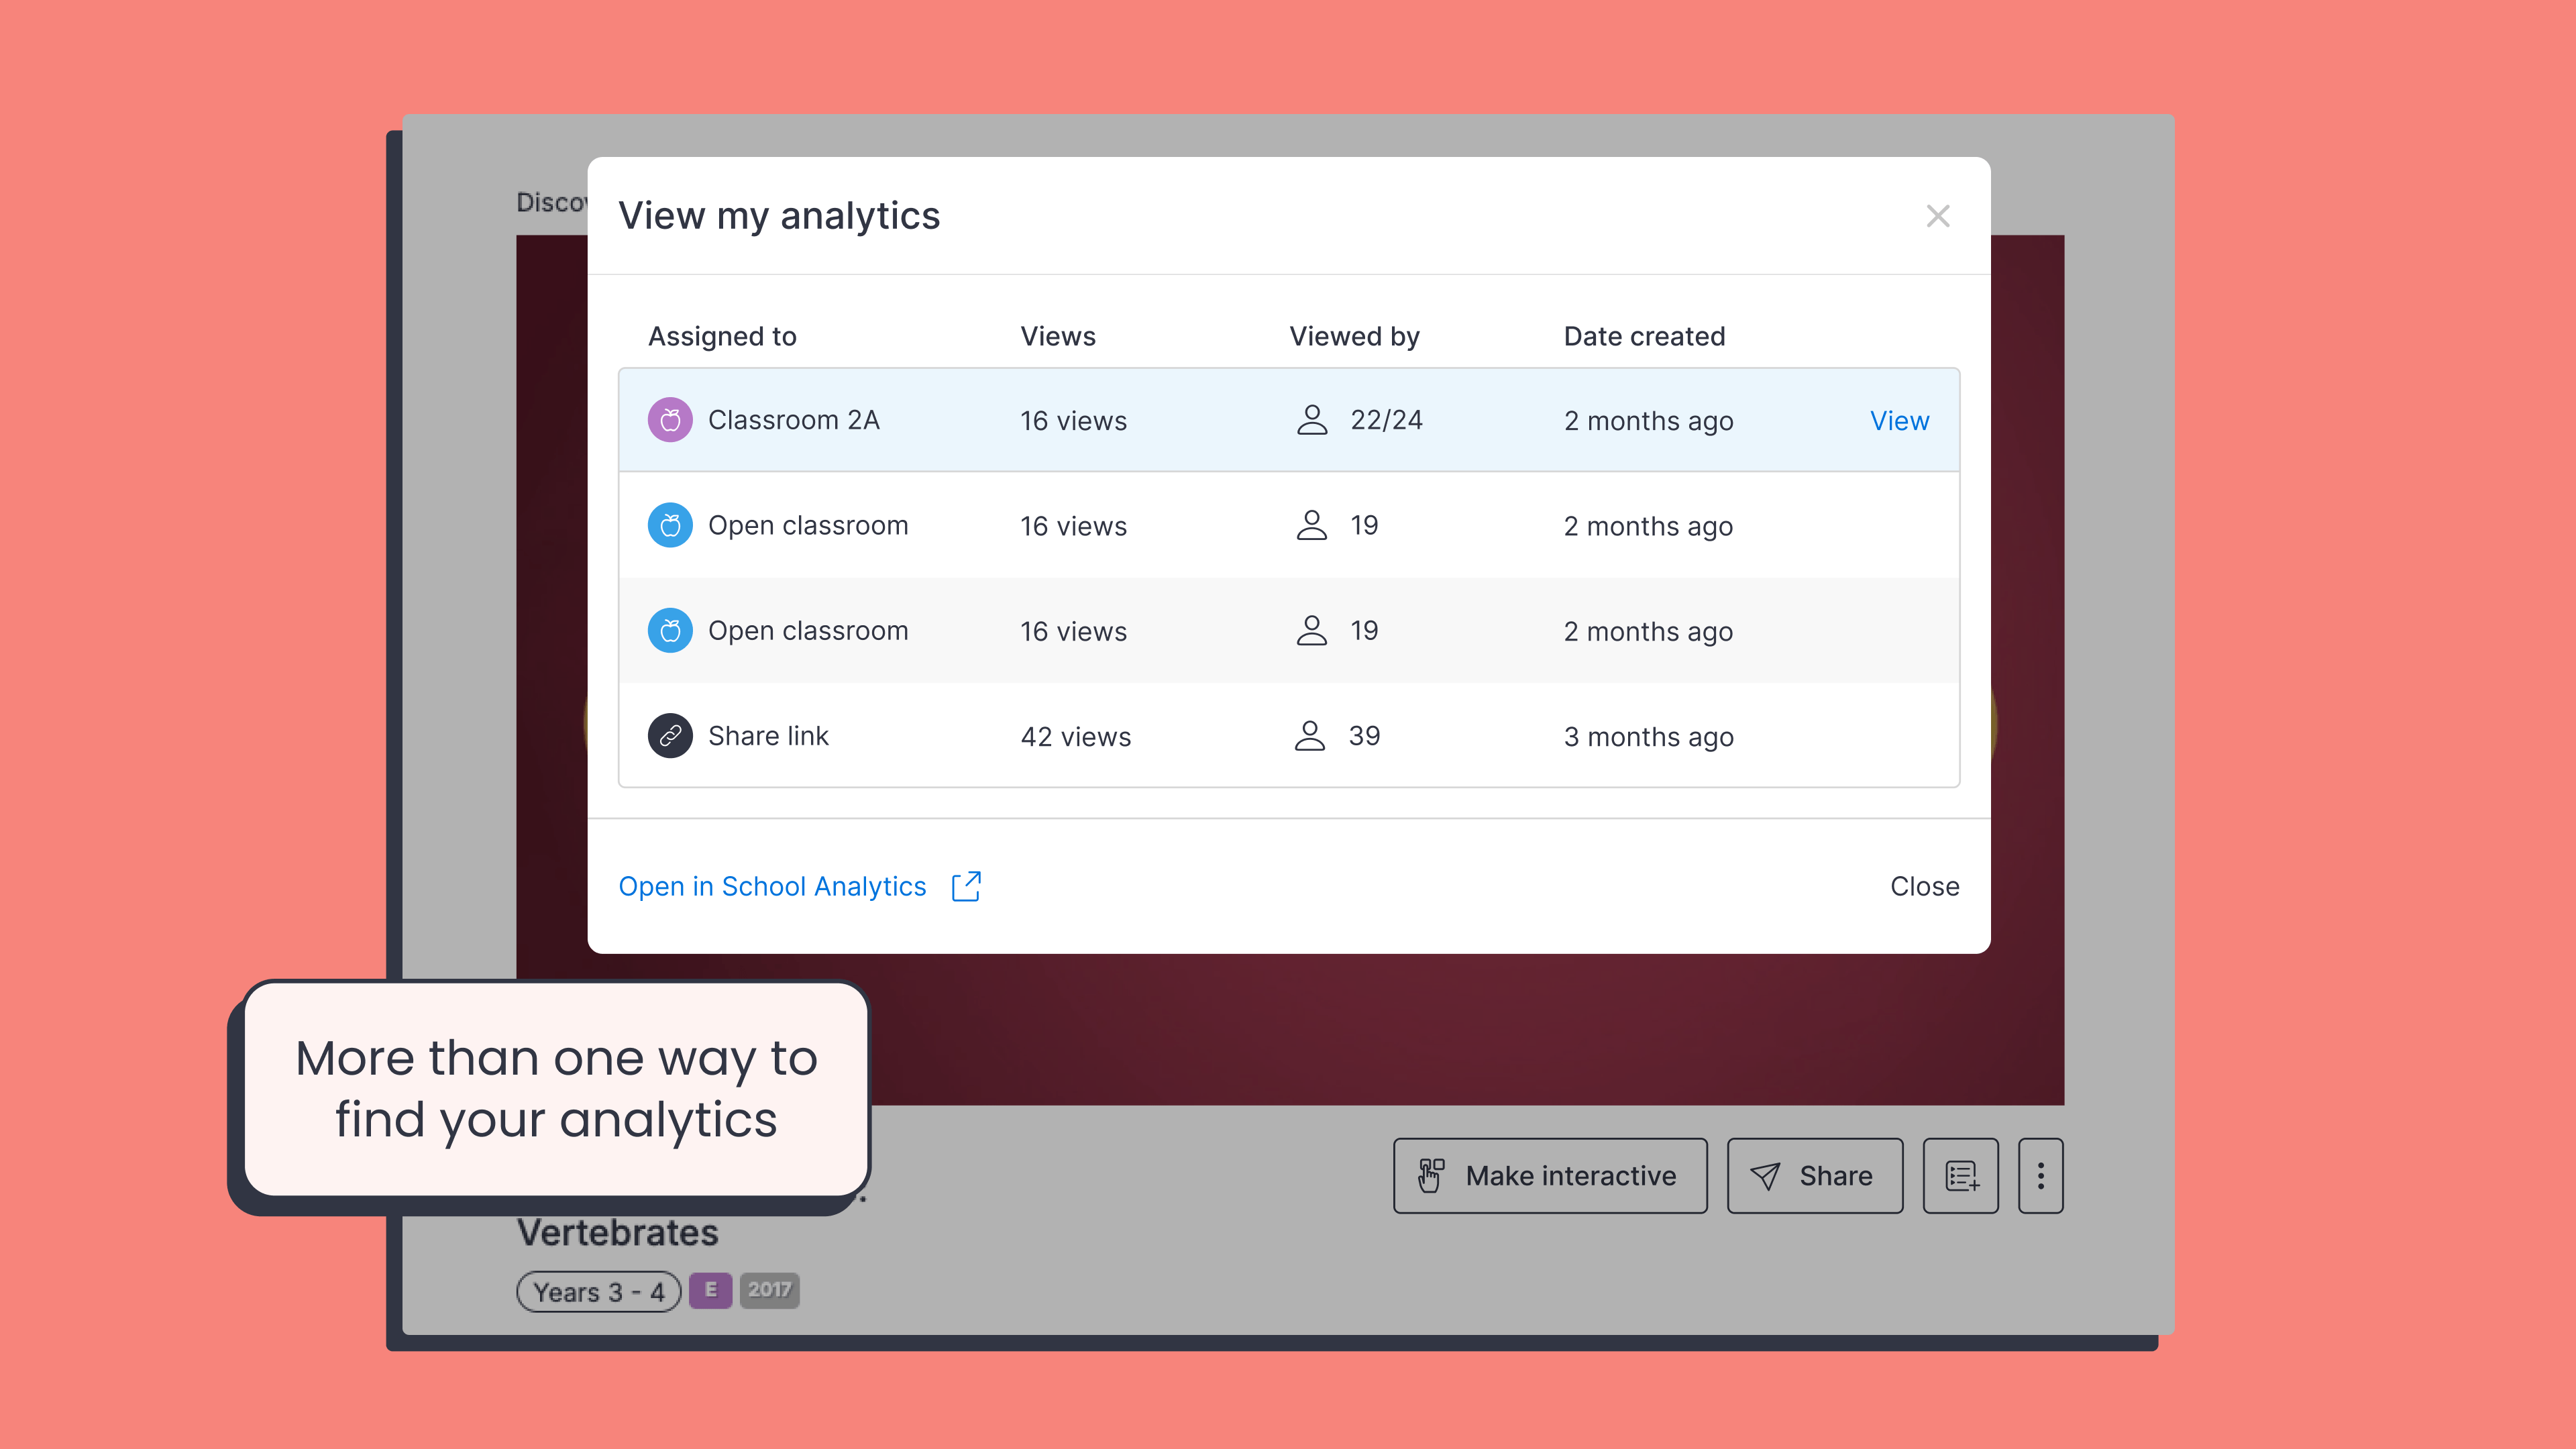
- Selecting “View my analytics” under the dropdown for a video
What teachers can see in their analytics
We’ve redesigned the layout based on teacher feedback to make the most useful information easier to find.
- See who has watched a video or completed an interactive quiz.
- Insight cards highlight student performance, including “Needs help,” “Ready for a challenge,” “Average score,” and more.
- Views from students who weren’t signed in still appear in the data.
- Deleted teacher or student accounts will continue to show up in analytics.
- Teacher views are now included for interactives, which is useful for tracking professional development or staff tutorials built into ClickView
What administrators can see in Analytics
With teacher data now accessible in-product, the separate Analytics area is now for school and district administrators only. It’s been updated with clearer charts and a simpler layout.
- Views from signed-out users appear as ‘Anonymous’
- Data from deleted accounts is still included in reports
Tips and tricks:
- Use ‘Classrooms’ to track engagement on videos you’ve assigned.
- Look for insight cards to help tailor follow-up lessons or support.
- Check the Shares section to track student views for any shared video, including ones with ‘Join codes’.
- Want to use interactives for professional development? Teacher views now show up too!
- For Admin users, use updated charts in Analytics to track school-wide engagement at a glance.
As always, we’d love your feedback – this feature was built in direct response to it. Keep sharing your ideas here so we can keep making ClickView better for everyone.
Share to

Joe Pour
briefcase iconChief Product Officer
Experienced product leader with a strong background in engineering and building innovative products at scale.
Other posts


Want more content like this?
Subscribe for blog updates, monthly video releases, trending topics, and exclusive content delivered straight to your inbox.
