
New to School analytics: Classroom views
Published on 2 min read
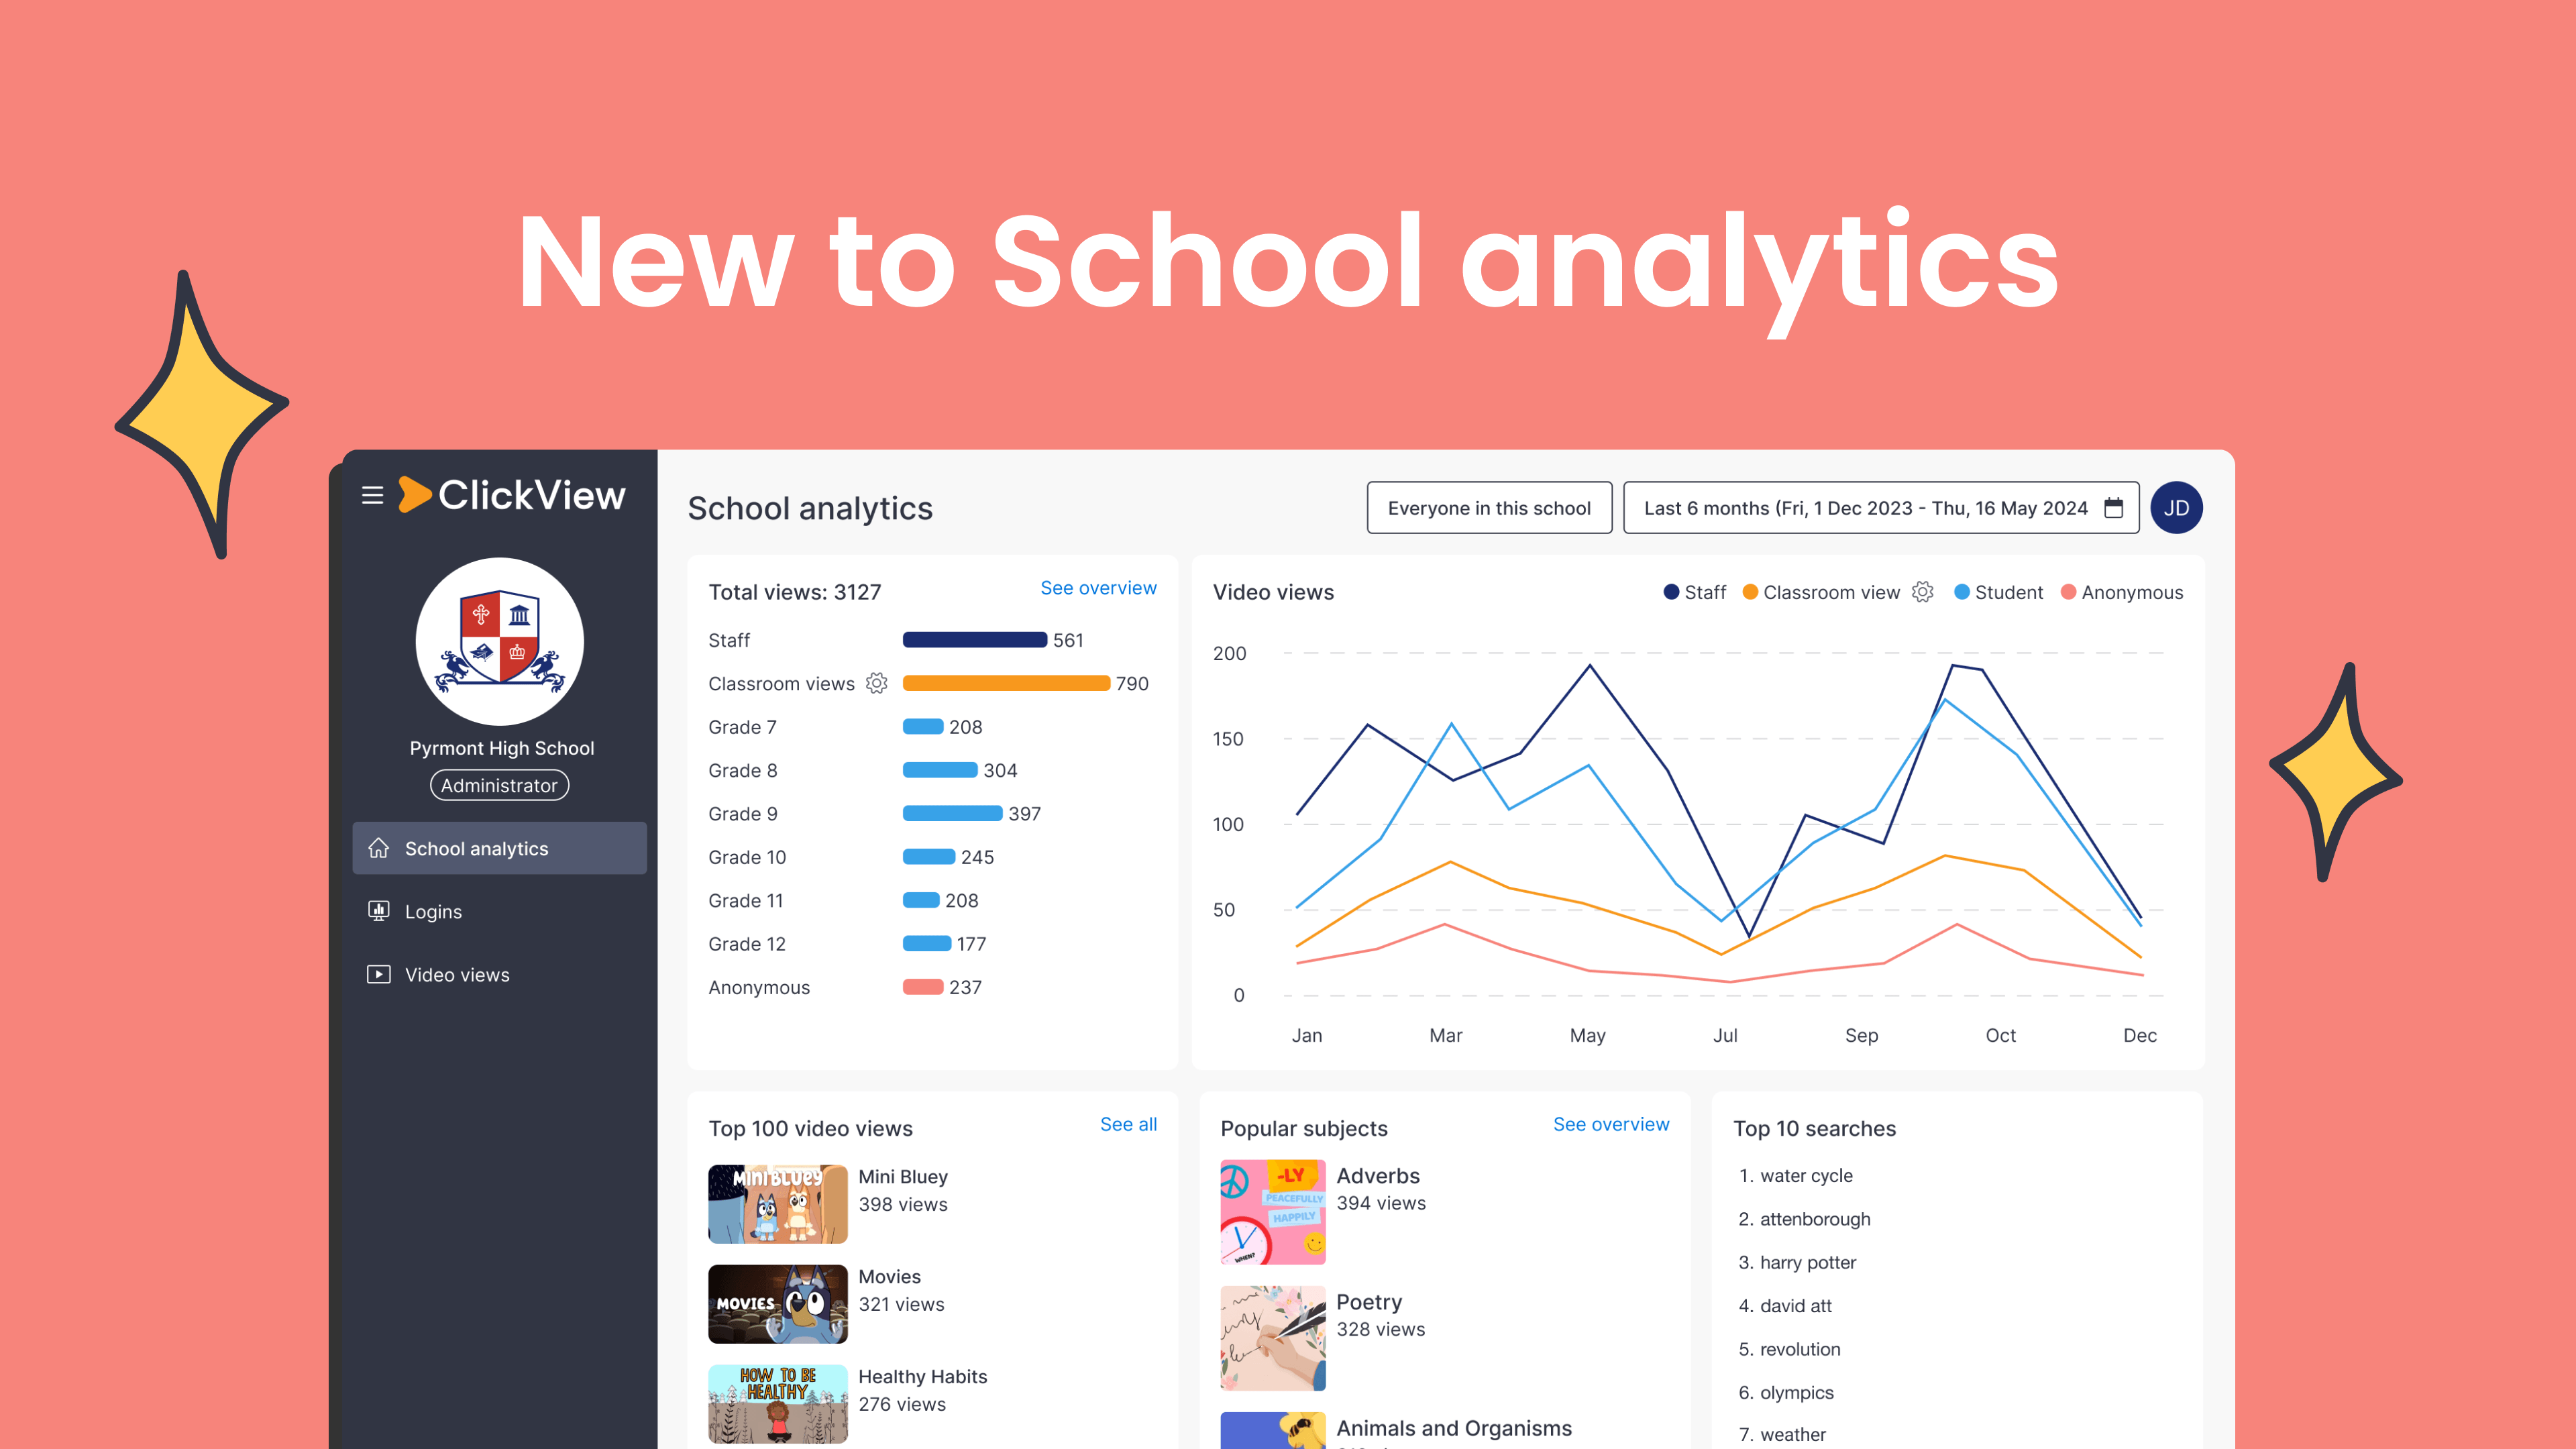
We’ve added a new metric to School analytics called Classroom views, so you can see the true impact of video across your school.
What’s new
School analytics now includes Classroom views, a metric for school administrators that estimates how many students are impacted during teacher-led, front-of-classroom video sessions, not just individual views.
This gives you an accurate view of how many students are engaging with videos across your school.
Research and user feedback
ClickView usage in schools has always included a mix of independent viewing and teacher-led, front-of-classroom playback. But School analytics previously counted both the same way, meaning classroom usage impacting 20 to 30 students looked identical to a single video view.
Administrators consistently highlighted these challenges:
- Difficulty showing the true reach of video learning across their school
- No way to reflect true classroom numbers in usage reports
- A need to separate teacher-led sessions from individual student videos
Our data revealed that many teachers watch videos in patterns consistent with front-of-classroom playback. This insight led directly to the development of Classroom views.
We ran an Early Access program with 39 schools between February and May 2026. Feedback from that group shaped the final feature and informed the name Classroom views, which clearly describes what the metric measures.
What’s changed
Previously, School analytics counted every view equally. A teacher playing a video to a class of 25 counted as one view, and there was no way to identify front-of-classroom sessions.
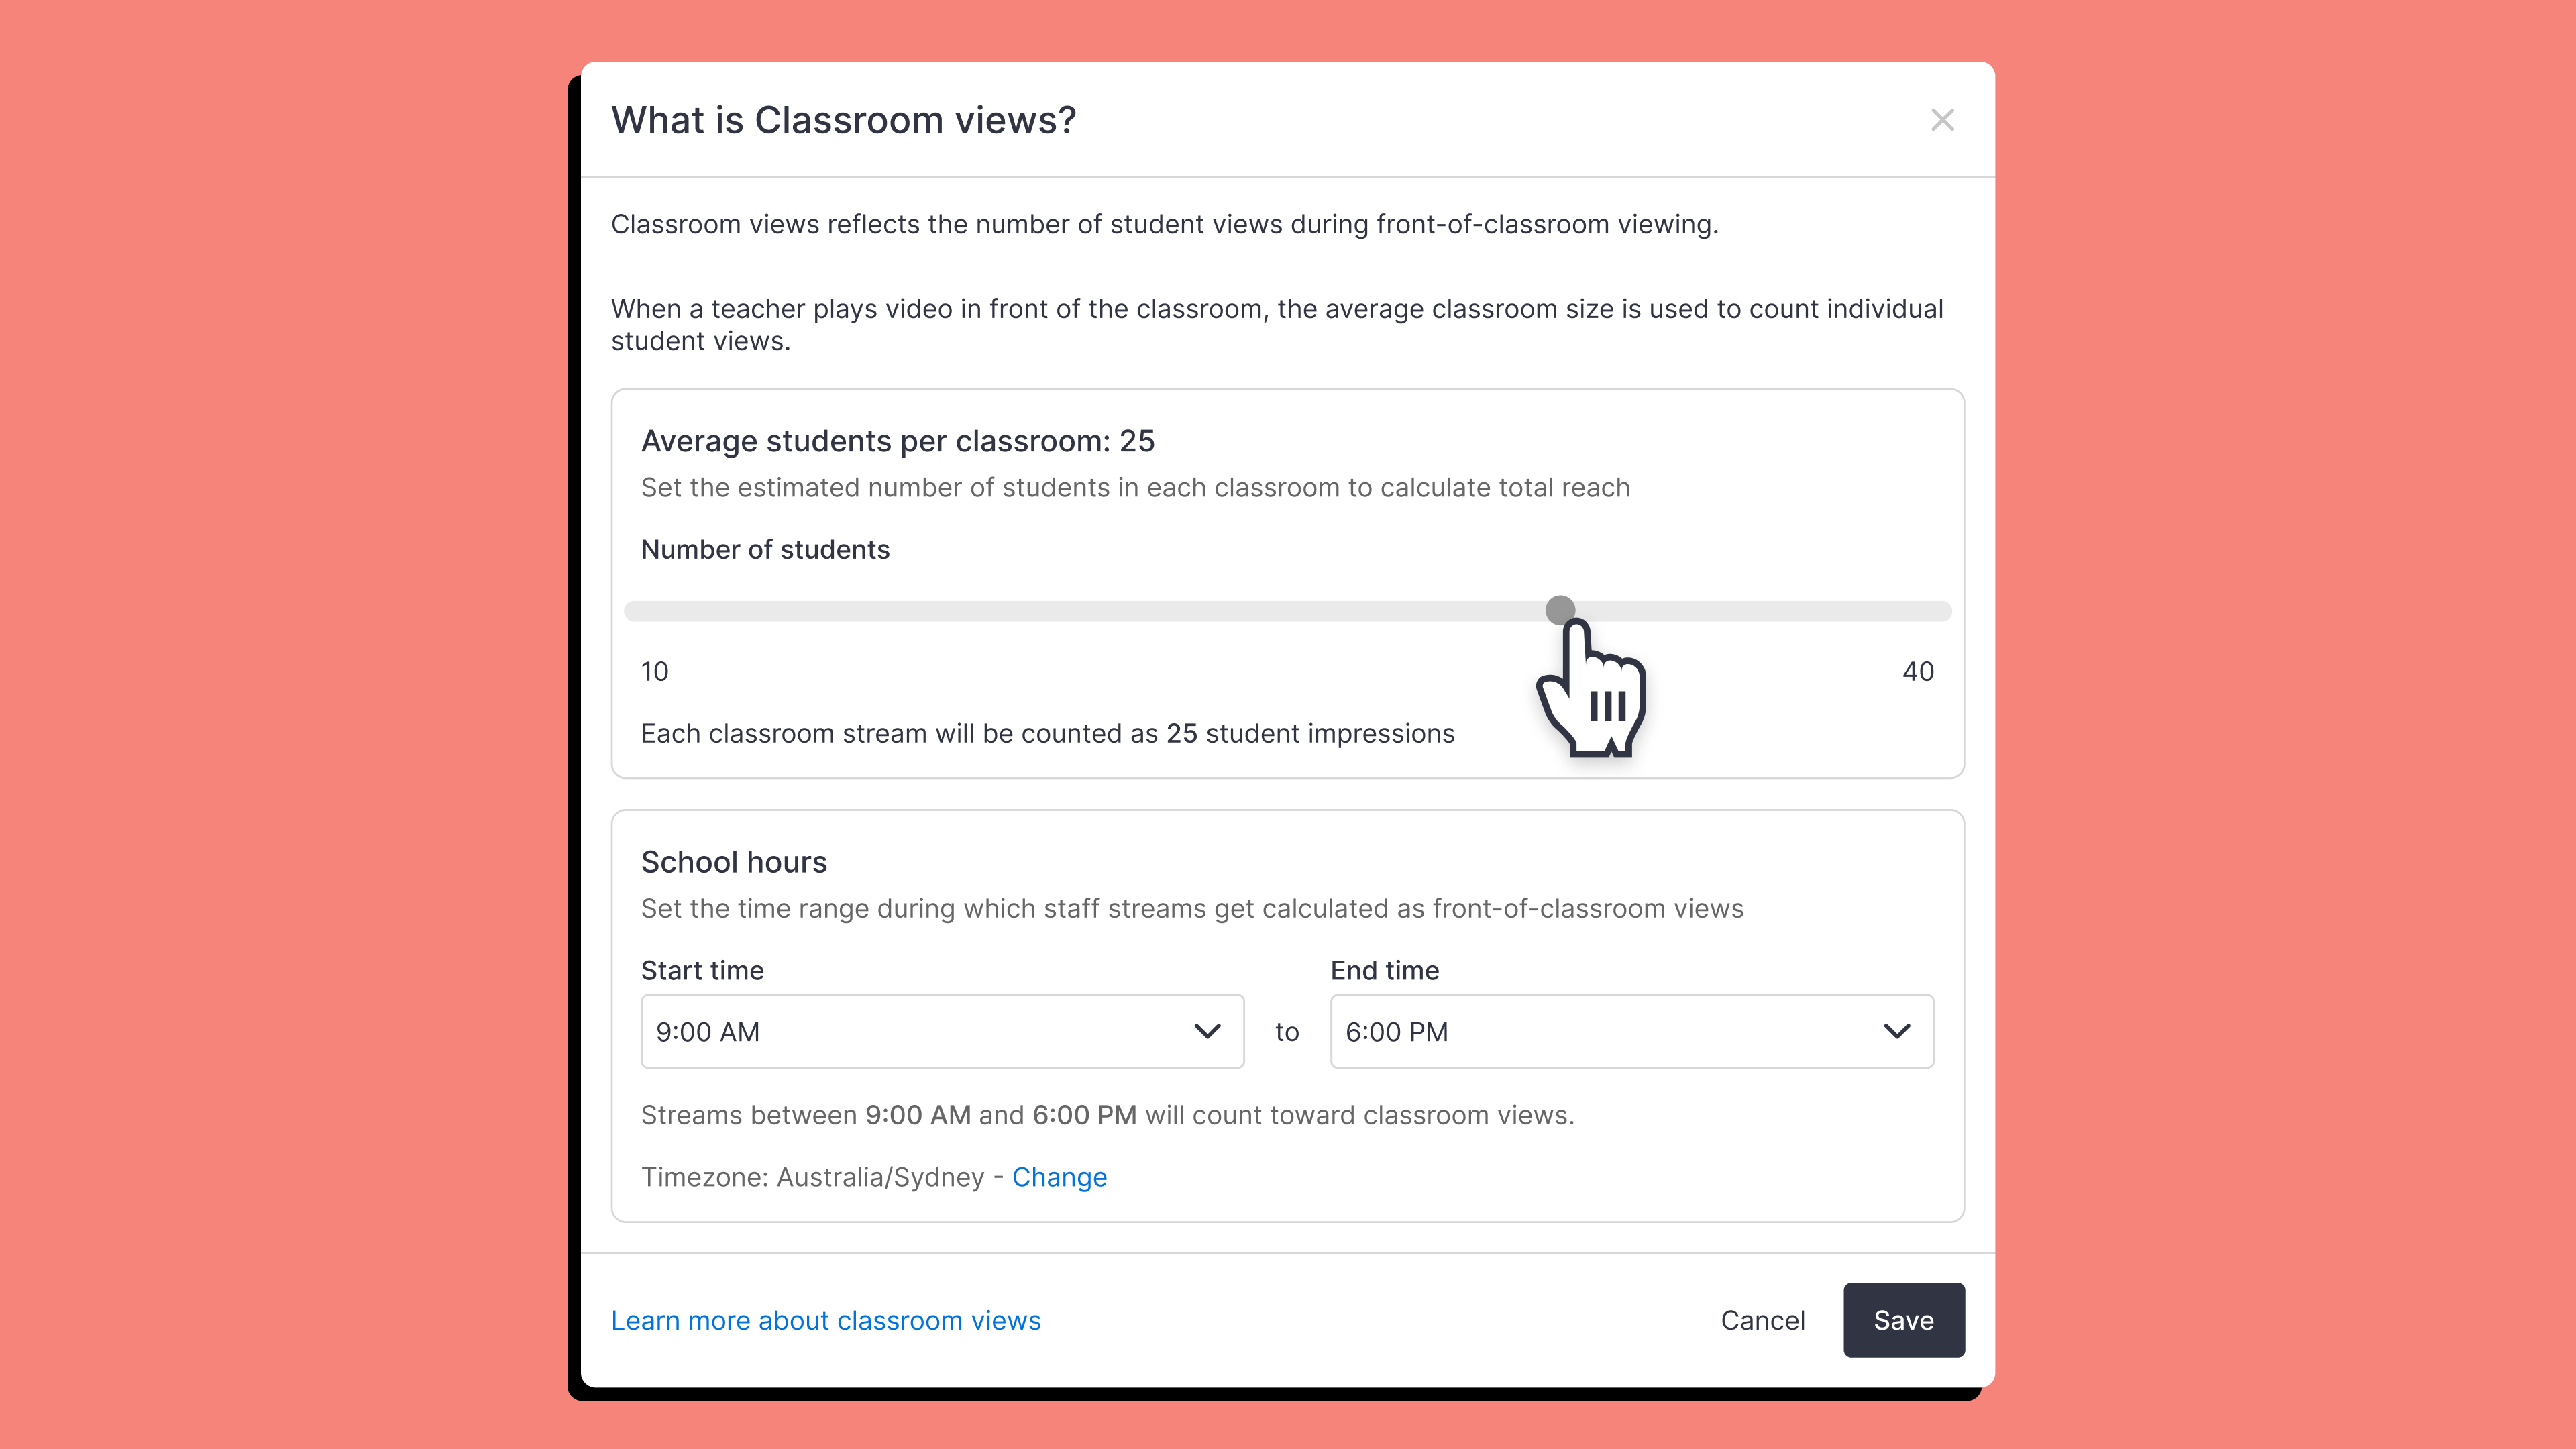
Now, ClickView automatically identifies teacher-led sessions when they continuously watch a video for longer than 10 minutes or watch more than 90% of the total video. These sessions are multiplied by an average classroom size (default: 25) to reflect the true number of students reached.
You’ll find Classroom views data across several areas of School analytics:
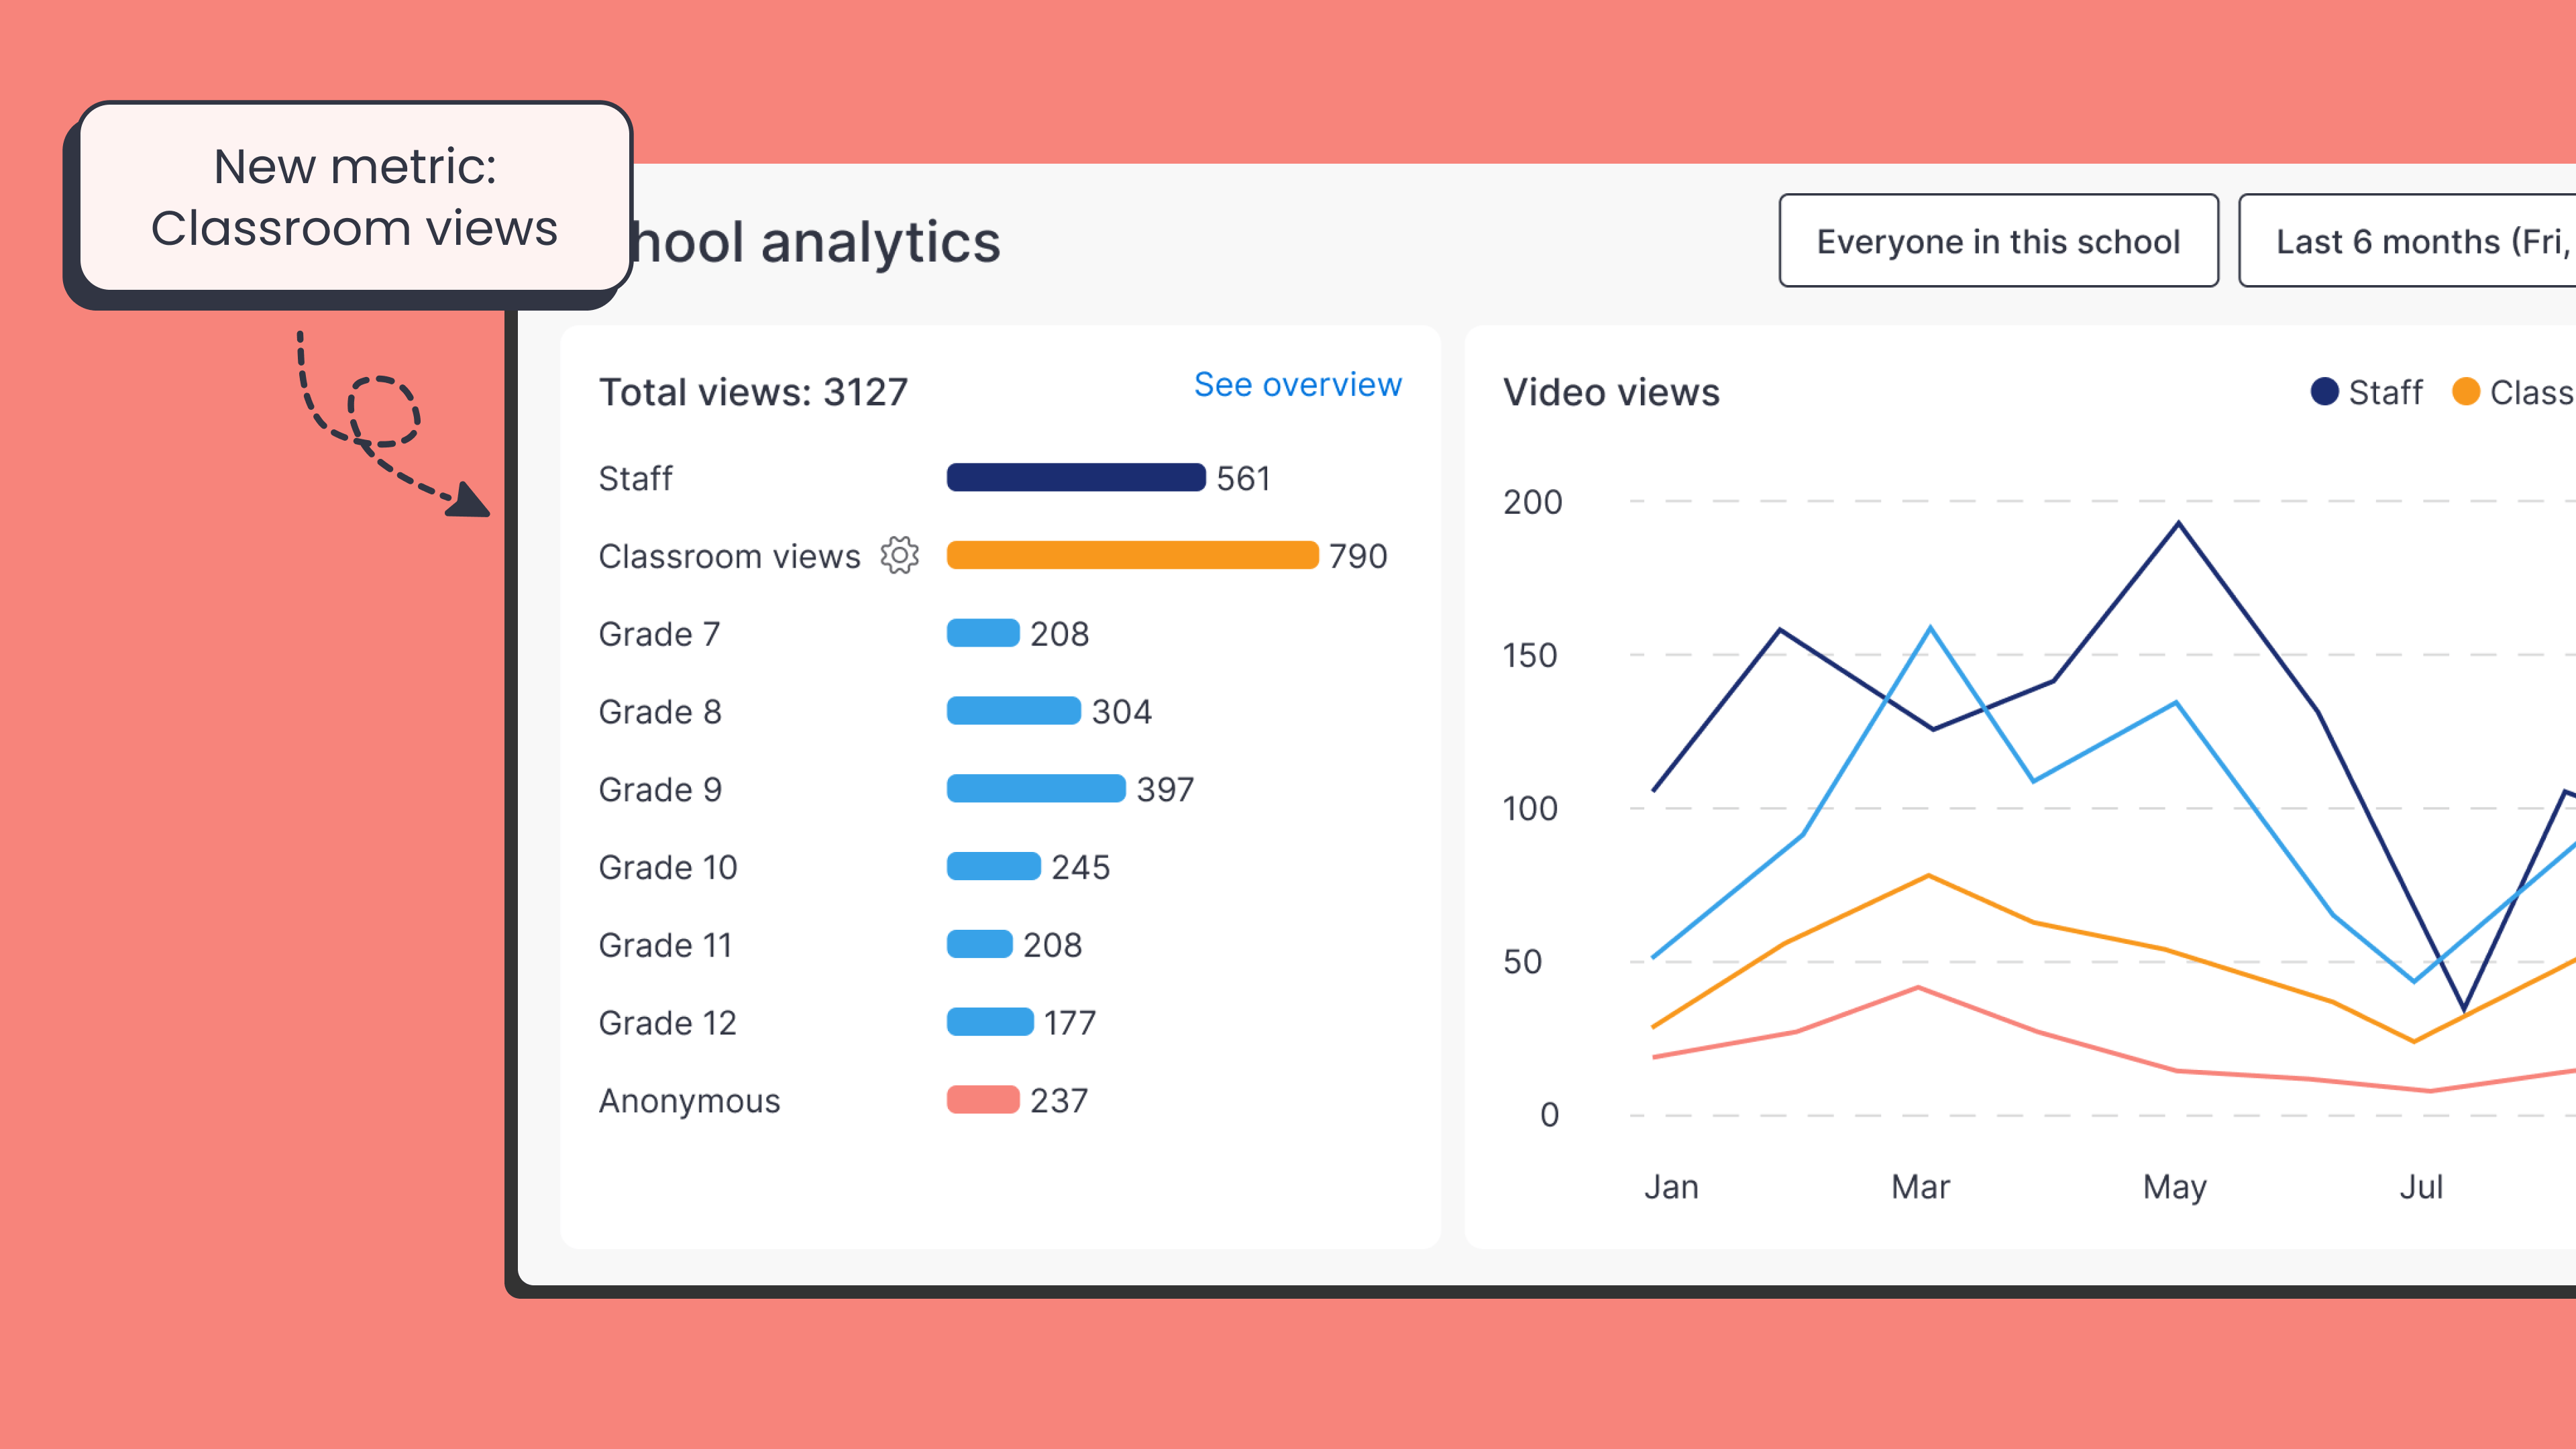
- School analytics dashboard: an additional bar in Total views charts and an additional line in histograms
- Video views dashboard: integrated into Total views by role, source, subject and topic breakdowns
- Individual Video dashboards: included in all histograms, charts and heatmaps
For a detailed breakdown of how Classroom views works, head over to our Help Center article.
Tips and tricks
- Use Classroom views in School analytics to show total student reach when reviewing usage
- Check the Video Views dashboard to find which videos generate the most classroom reach
- Adjust the classroom size slider to match your school’s average for more accurate reporting
- Select your school’s start and end times to limit classroom views to your school’s operating hours
- Compare Classroom views term over term or semester over semester to track how classroom video usage trends over time
As always, we’d love to hear your feedback. Keep sharing your ideas so we can make ClickView even better for everyone.
Share to

Joe Pour
briefcase iconChief Product Officer
Experienced product leader with a strong background in engineering and building innovative products at scale.
Other posts
Want more content like this?
Subscribe for blog updates, monthly video releases, trending topics, and exclusive content delivered straight to your inbox.