How to use Classroom views in School analytics

Summary
- Sign in with an Administrator account to access School analytics.
- Classroom views show how many students were impacted by teacher-led, front-of-classroom viewing sessions.
- Classroom views appear on the School analytics dashboard, the Video views dashboard, and individual Video dashboards.
- You can adjust the average classroom size using the cog icon (⚙️) and range slider.
Understanding Classroom views
ClickView usage in schools often includes a mix of 1-to-1 viewing and teacher-led, front-of-classroom playback. Classroom views provide administrators with clearer insight into how videos are used during classroom sessions.
Classroom views more accurately reflect how many students viewed videos during teacher-led sessions. These front-of-classroom sessions are identified using the following criteria:
- Videos continuously watched by staff members for longer than 10 minutes
- OR, videos where the staff member watched more than 90% of the total video
Once identified, these numbers are multiplied to take into account a typical classroom size of 25 students to give an overall Classroom views metric.
Where Classroom views metrics are available
Classroom views metrics are highlighted in multiple areas of Analytics.
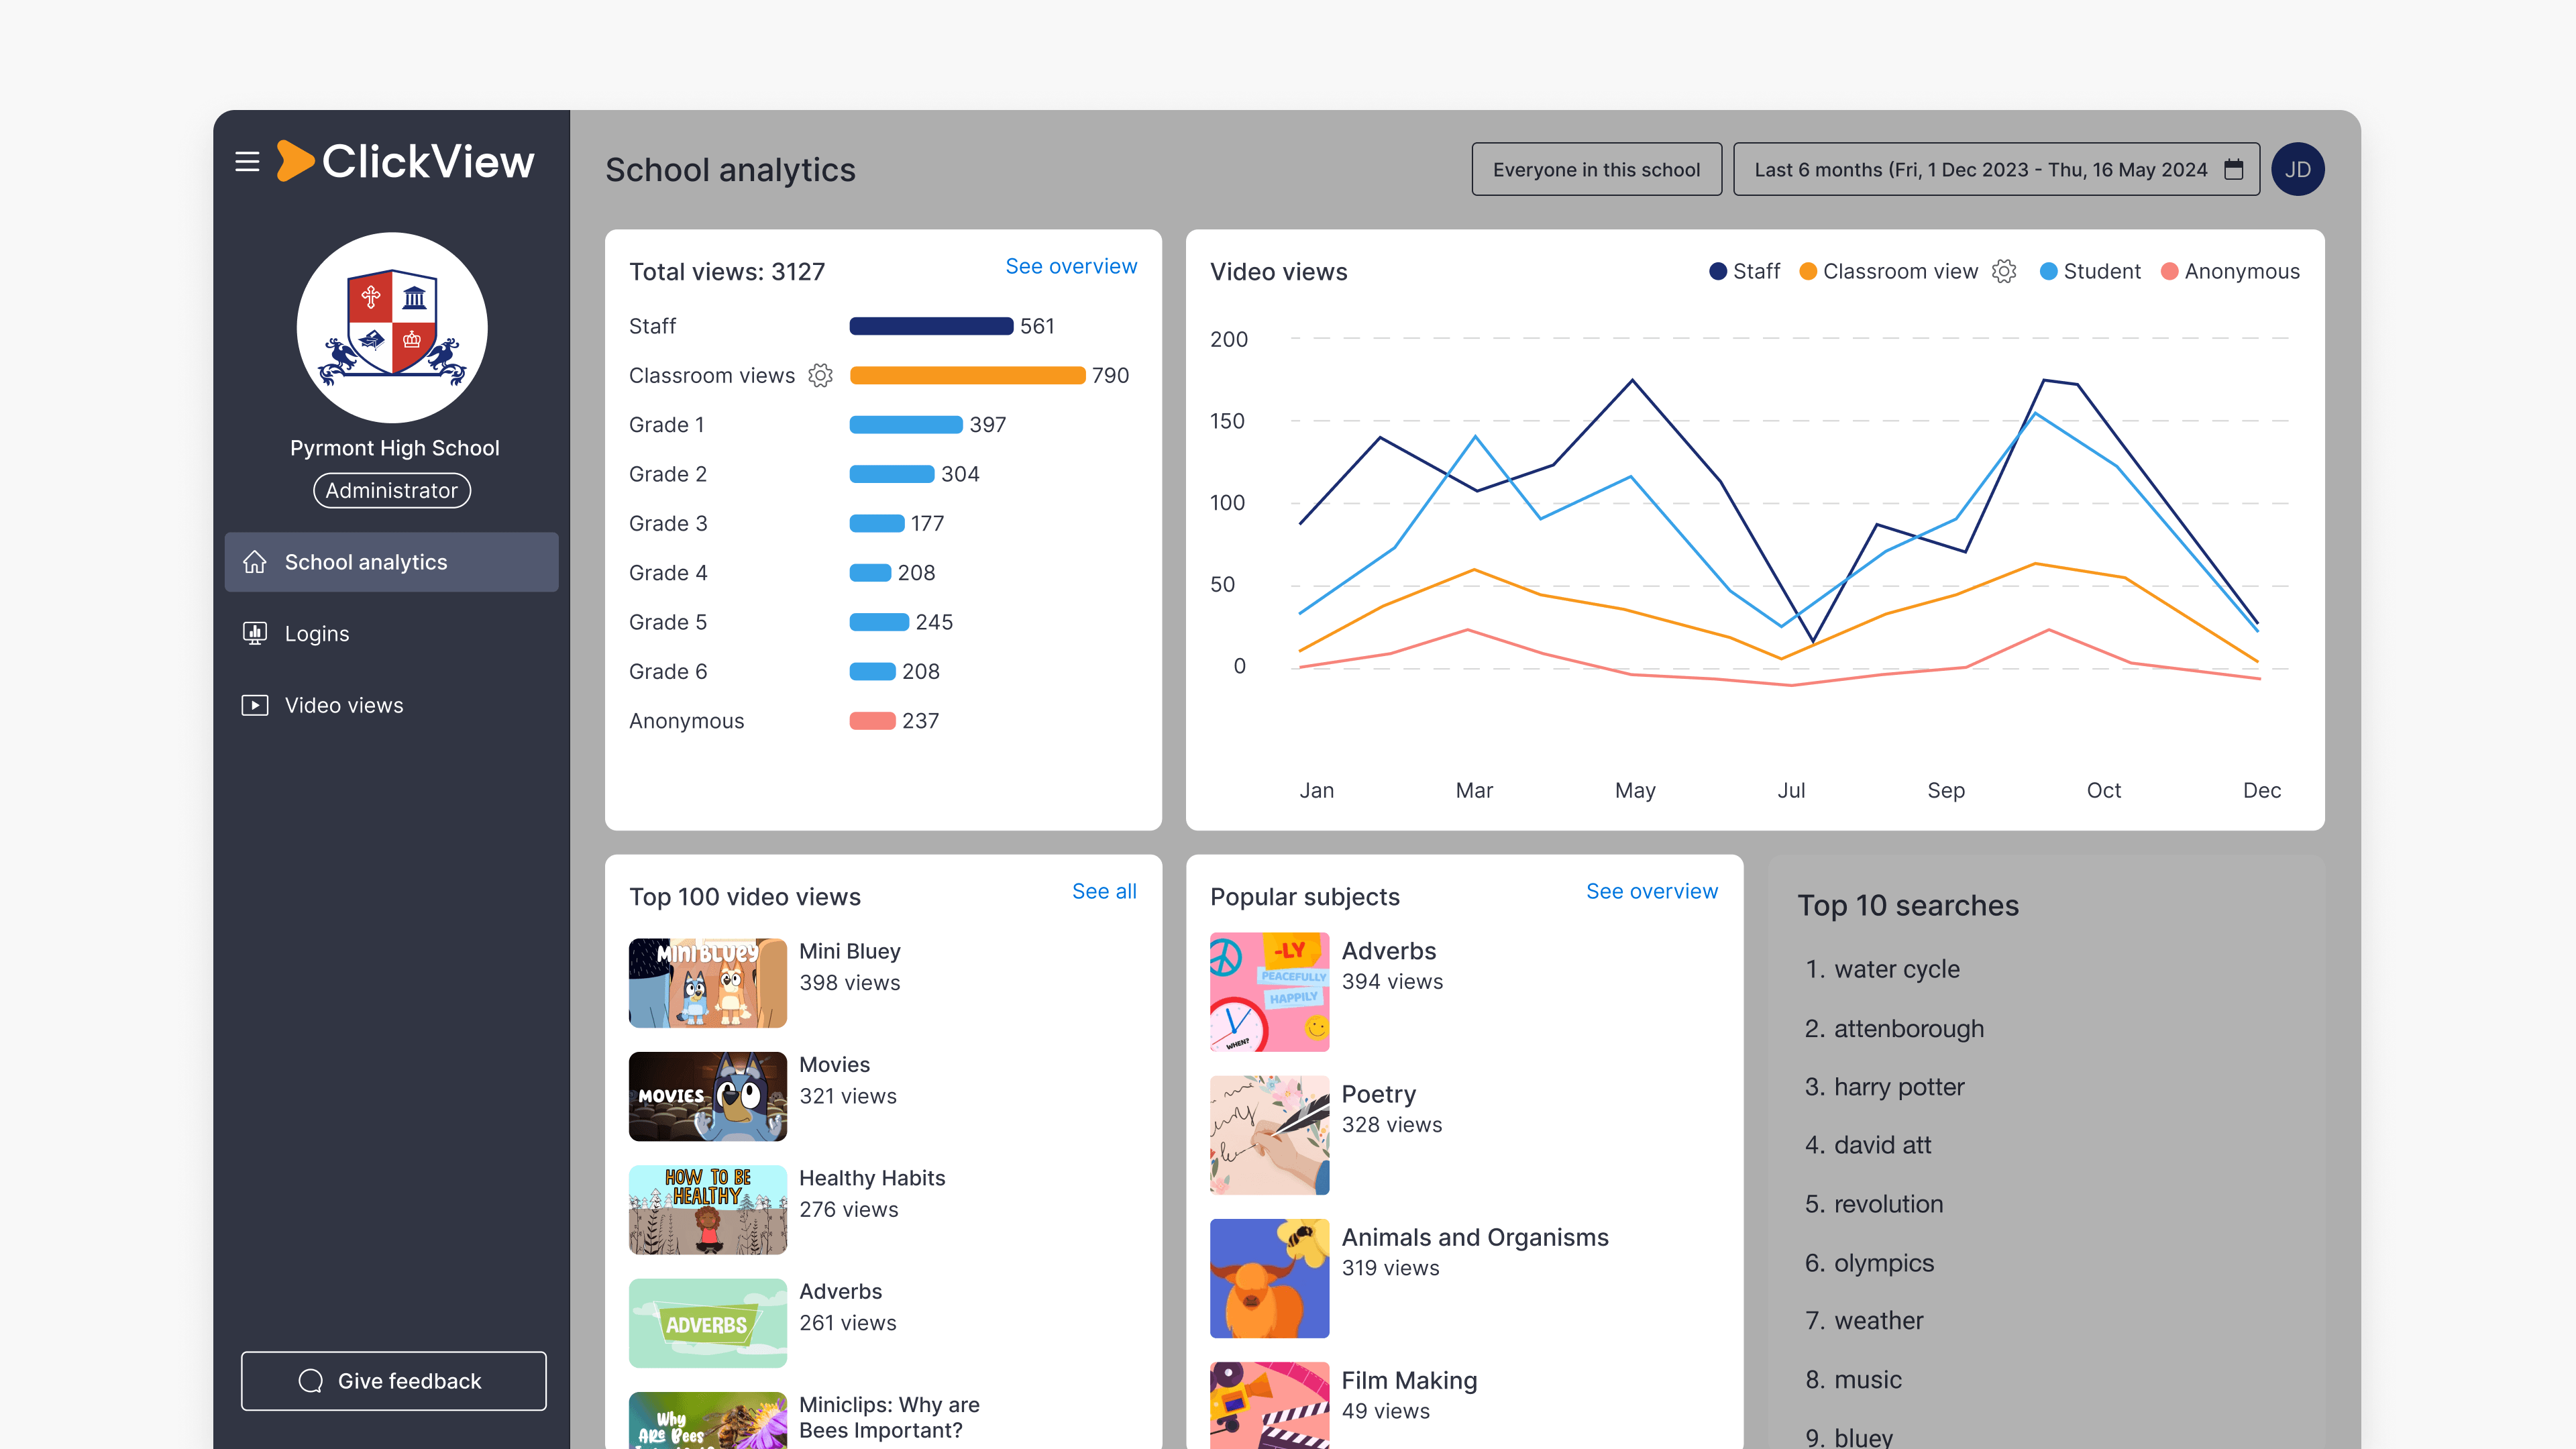
School analytics dashboard
- Total views bar chart (additional bar)
- Video views histogram (additional line)
- Popular subjects (integrated into source numbers)
View numbers in the Top 100 videos list include Classroom views as well as regular 1-to-1 user views.

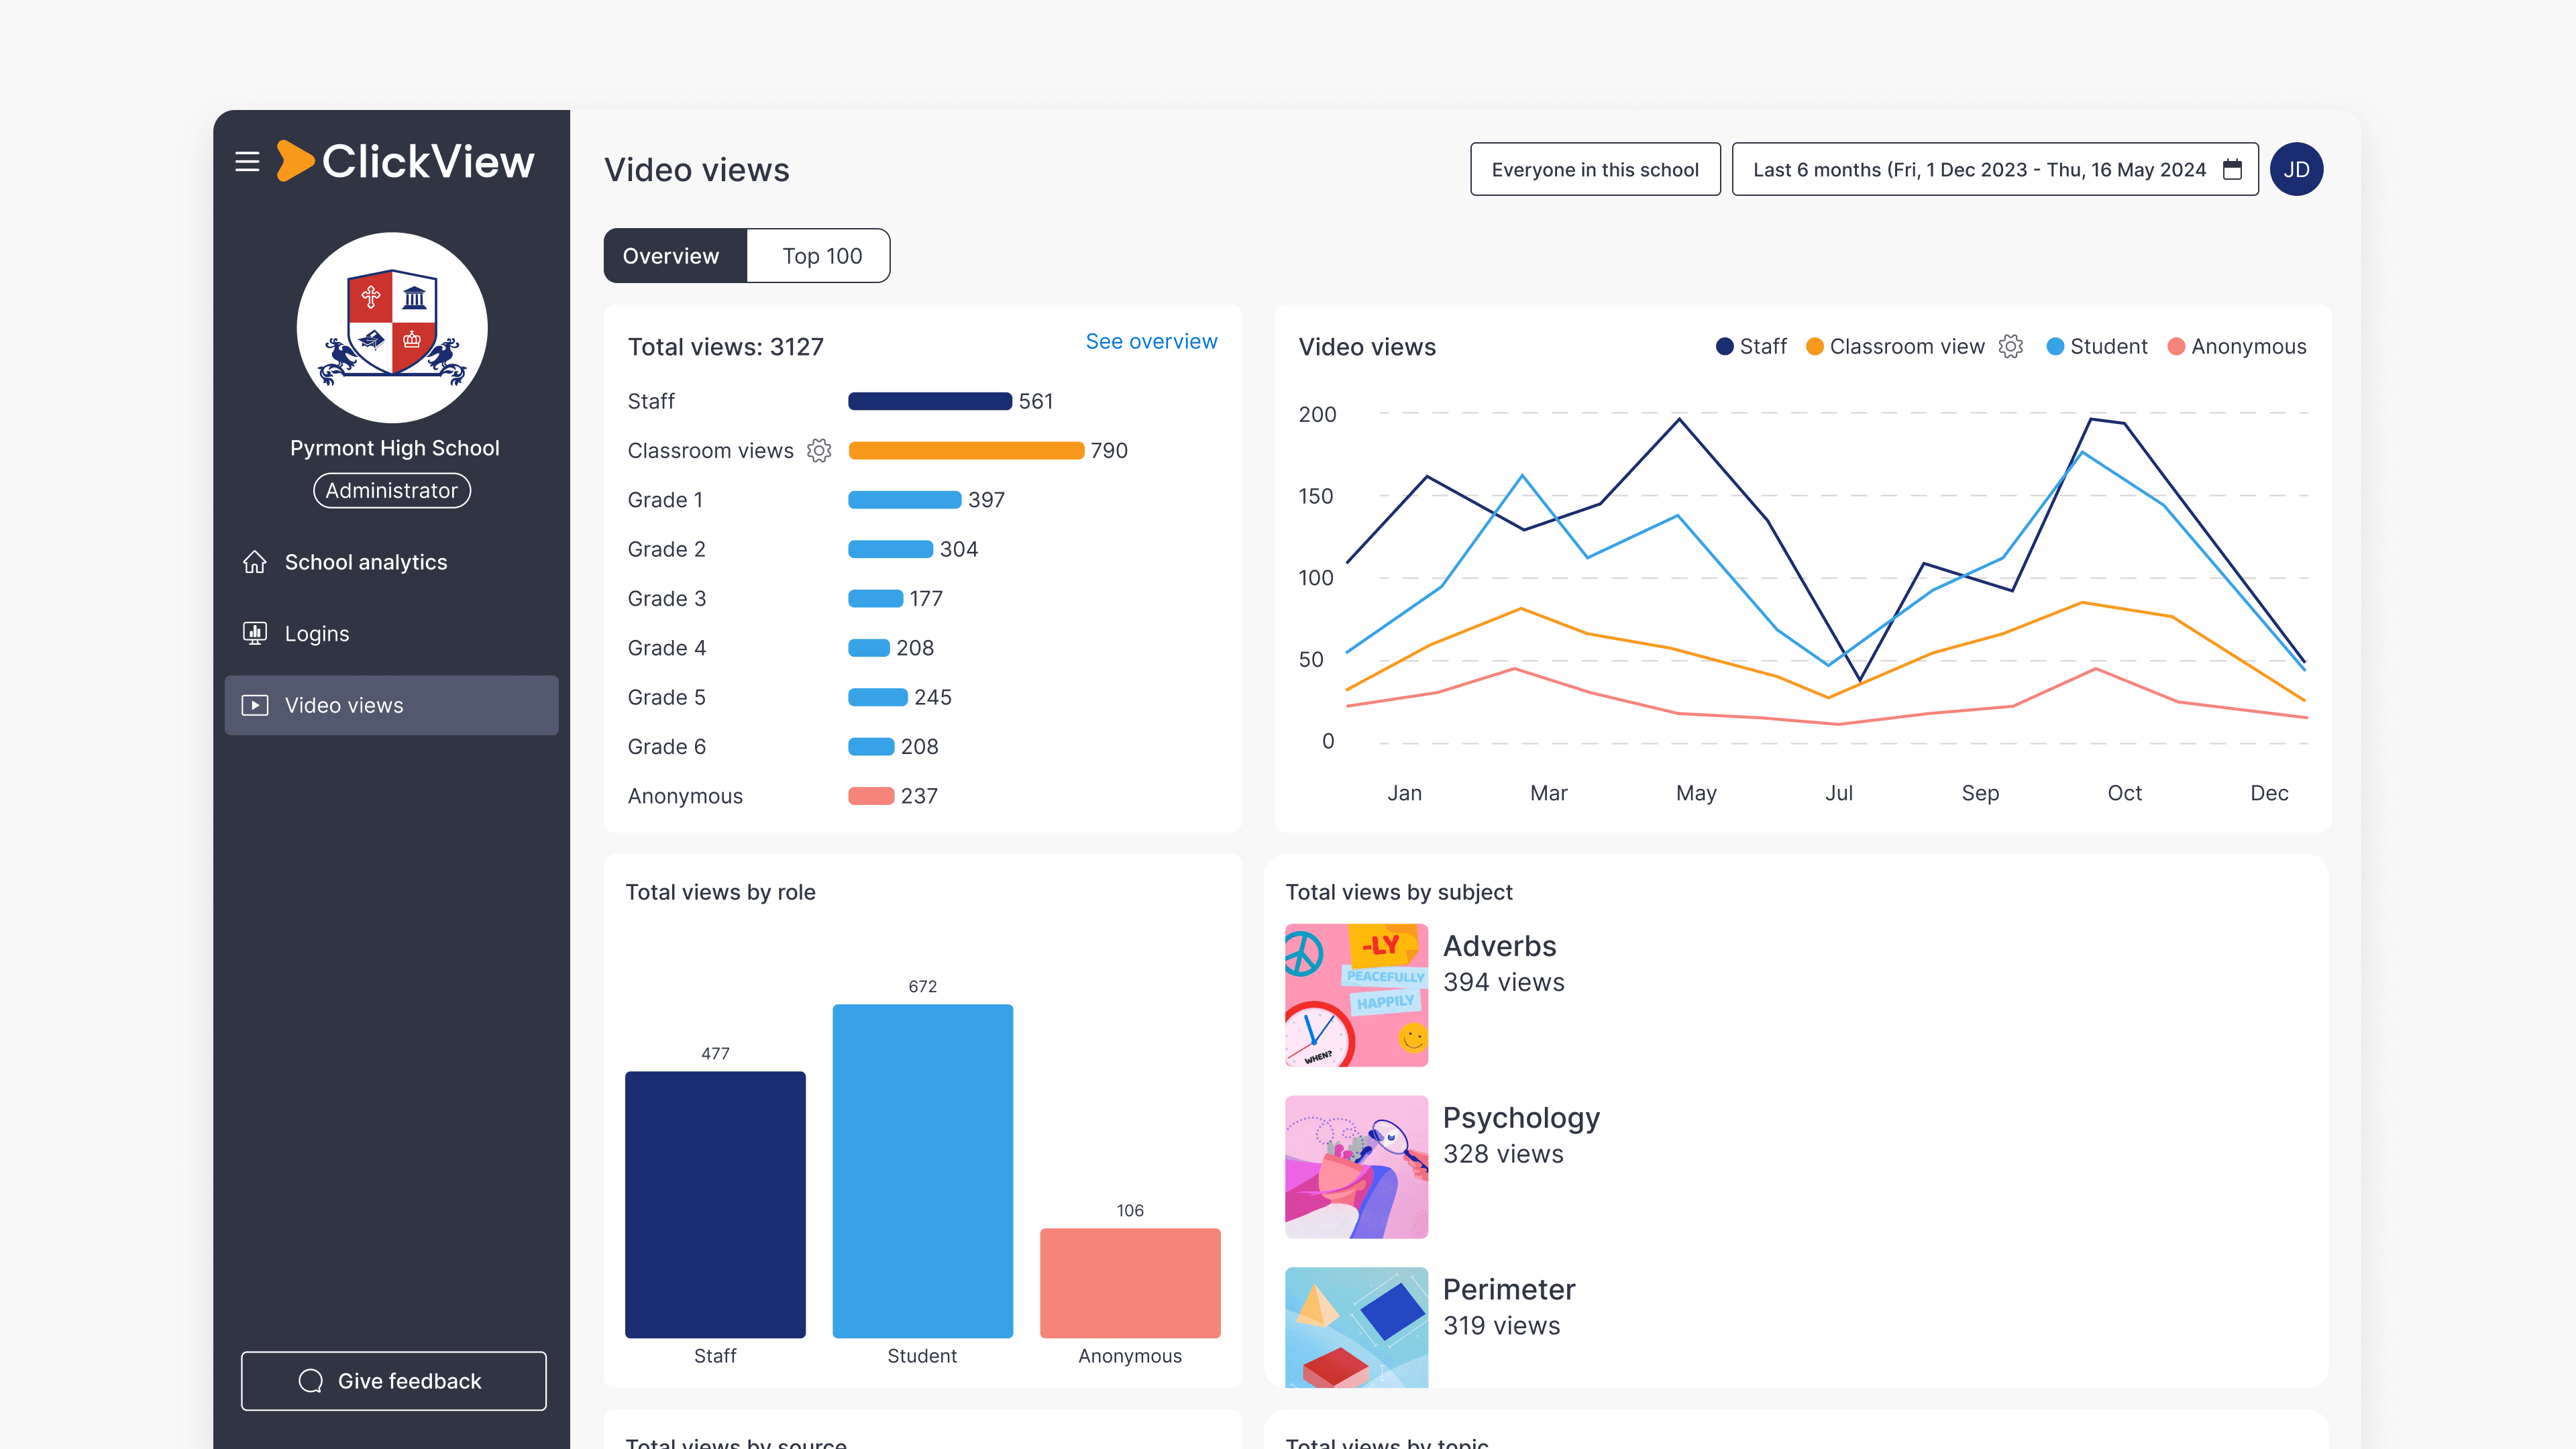
Video views dashboard
- Total views bar chart (additional bar)
- Video views histogram (additional line)
- Total views by role (integrated into role numbers)
- Total views by source (integrated into source numbers)
- Total views by subject (integrated into source numbers)
- Total views by topic (integrated into source numbers)
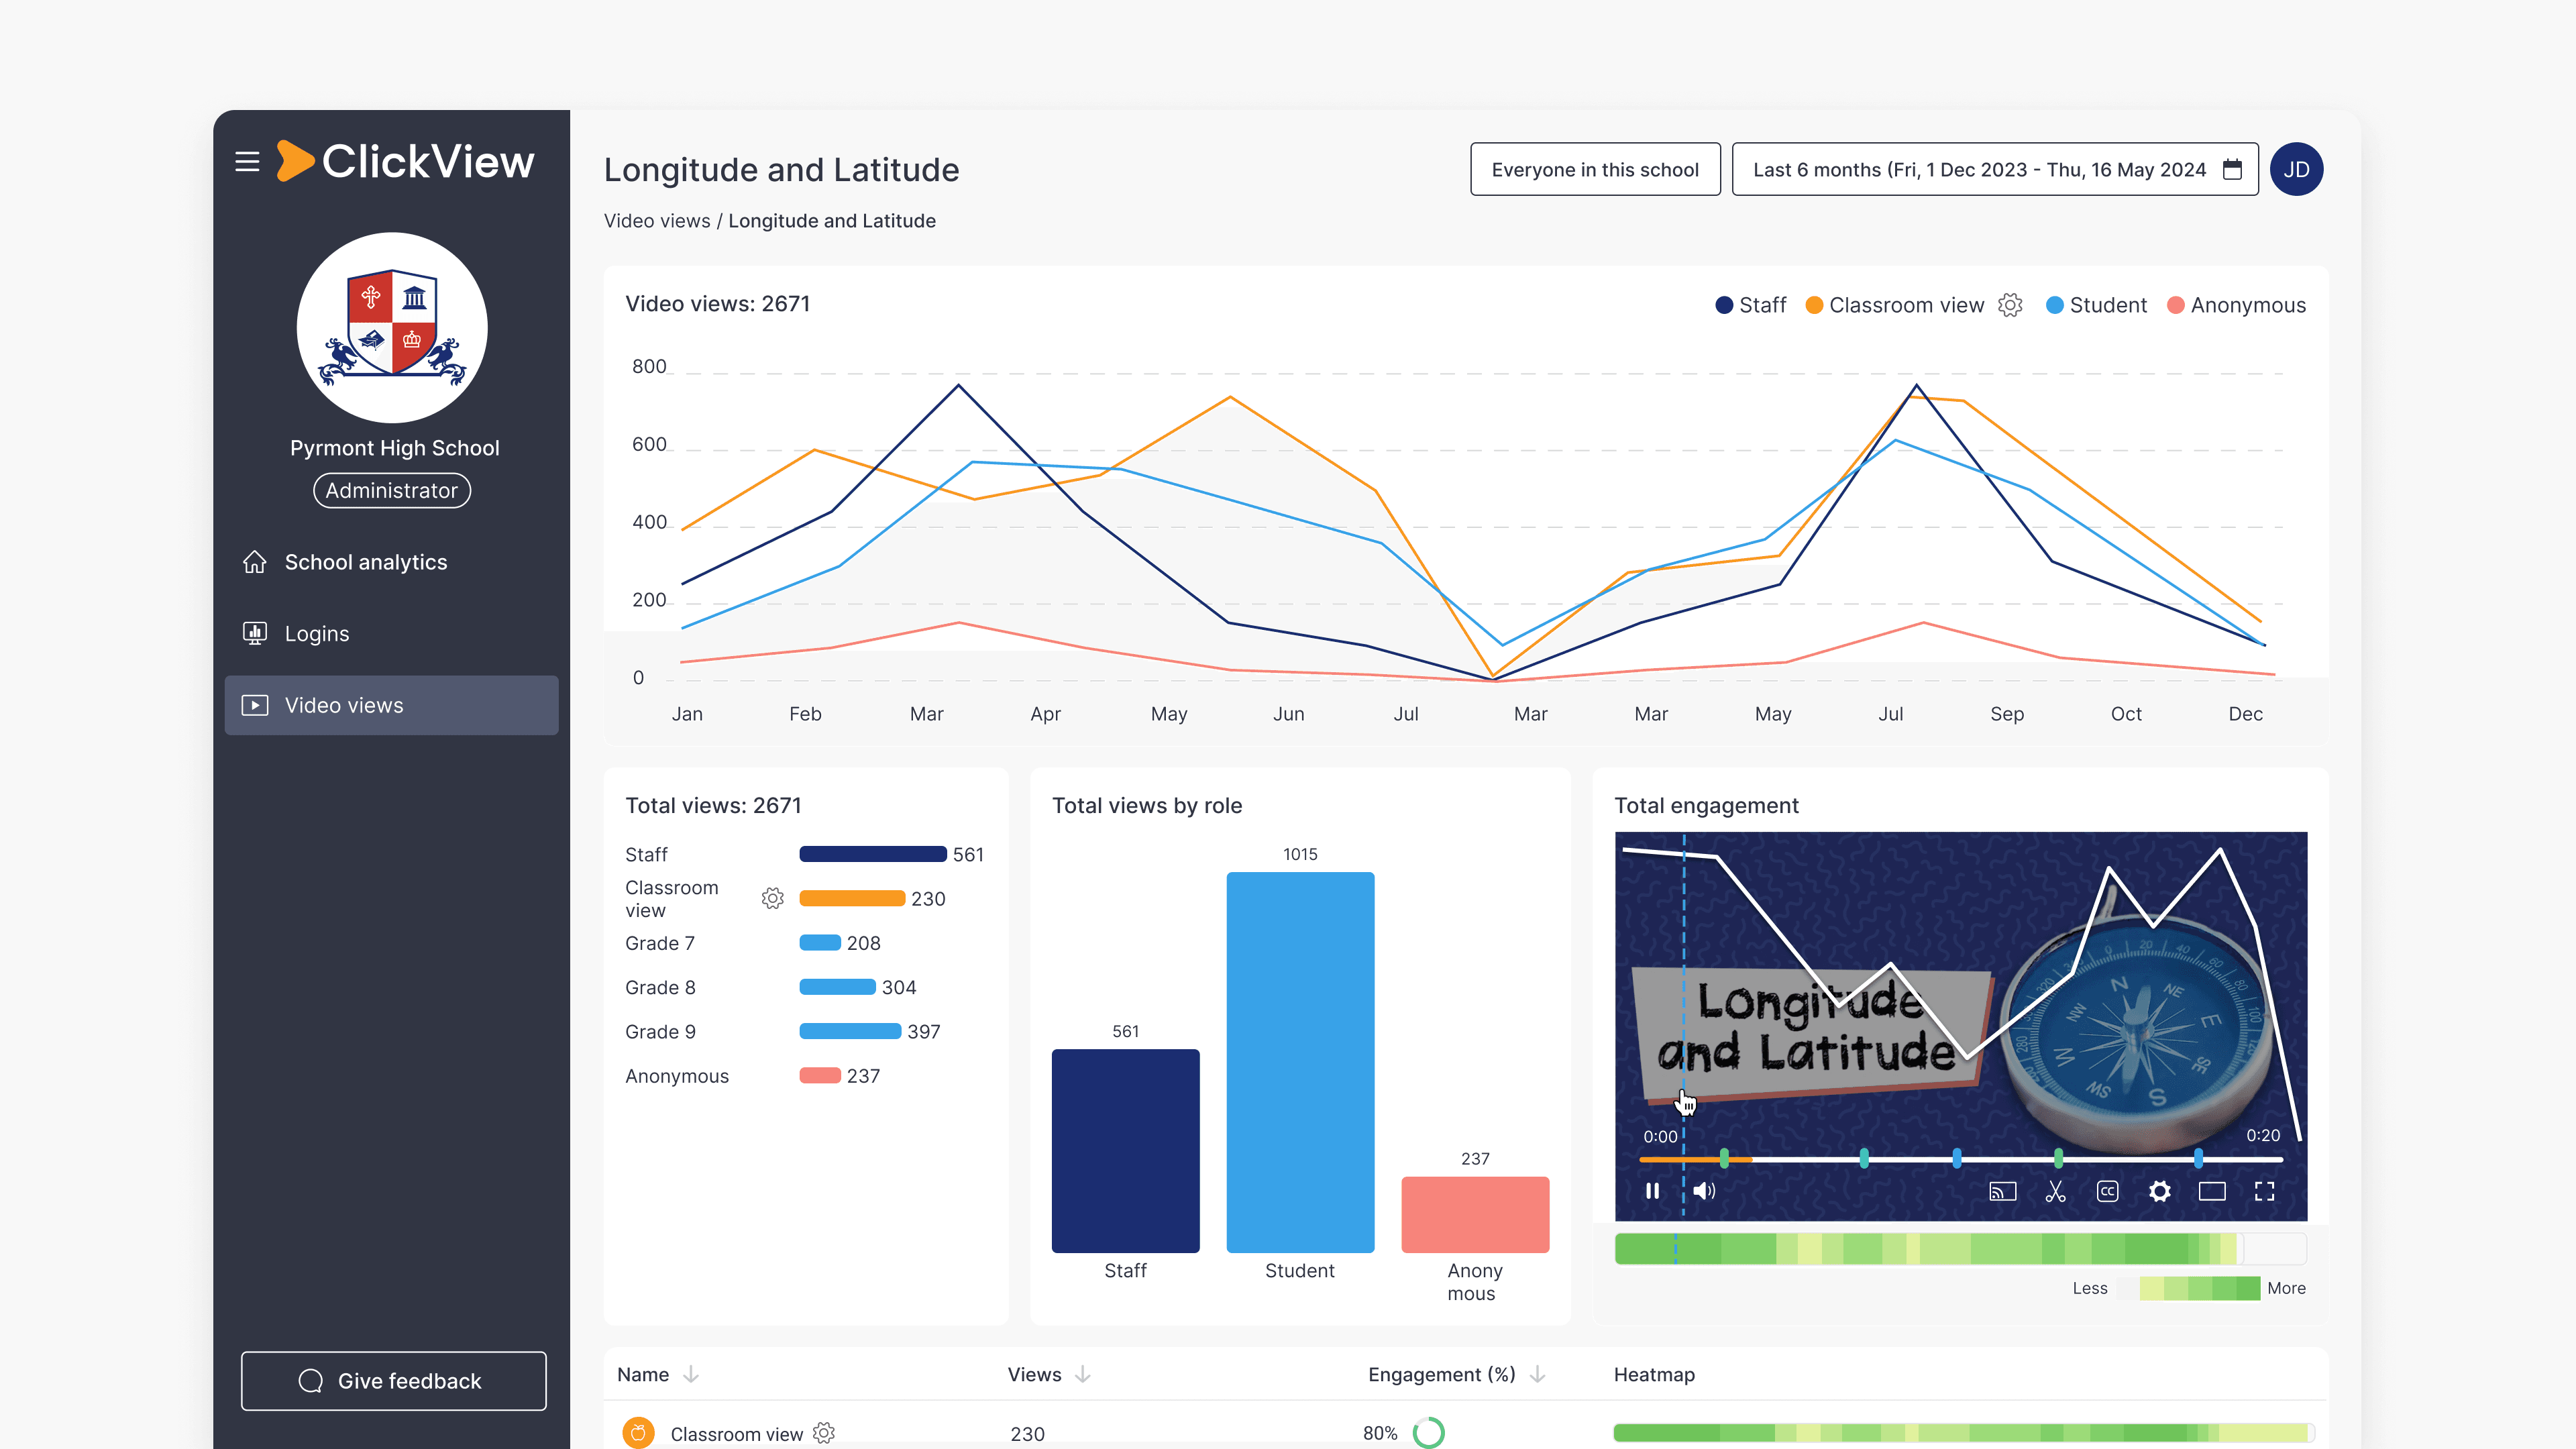
Individual Video dashboard
The Video dashboard for individual videos includes Classroom views data in all of the histograms, charts and heatmaps.
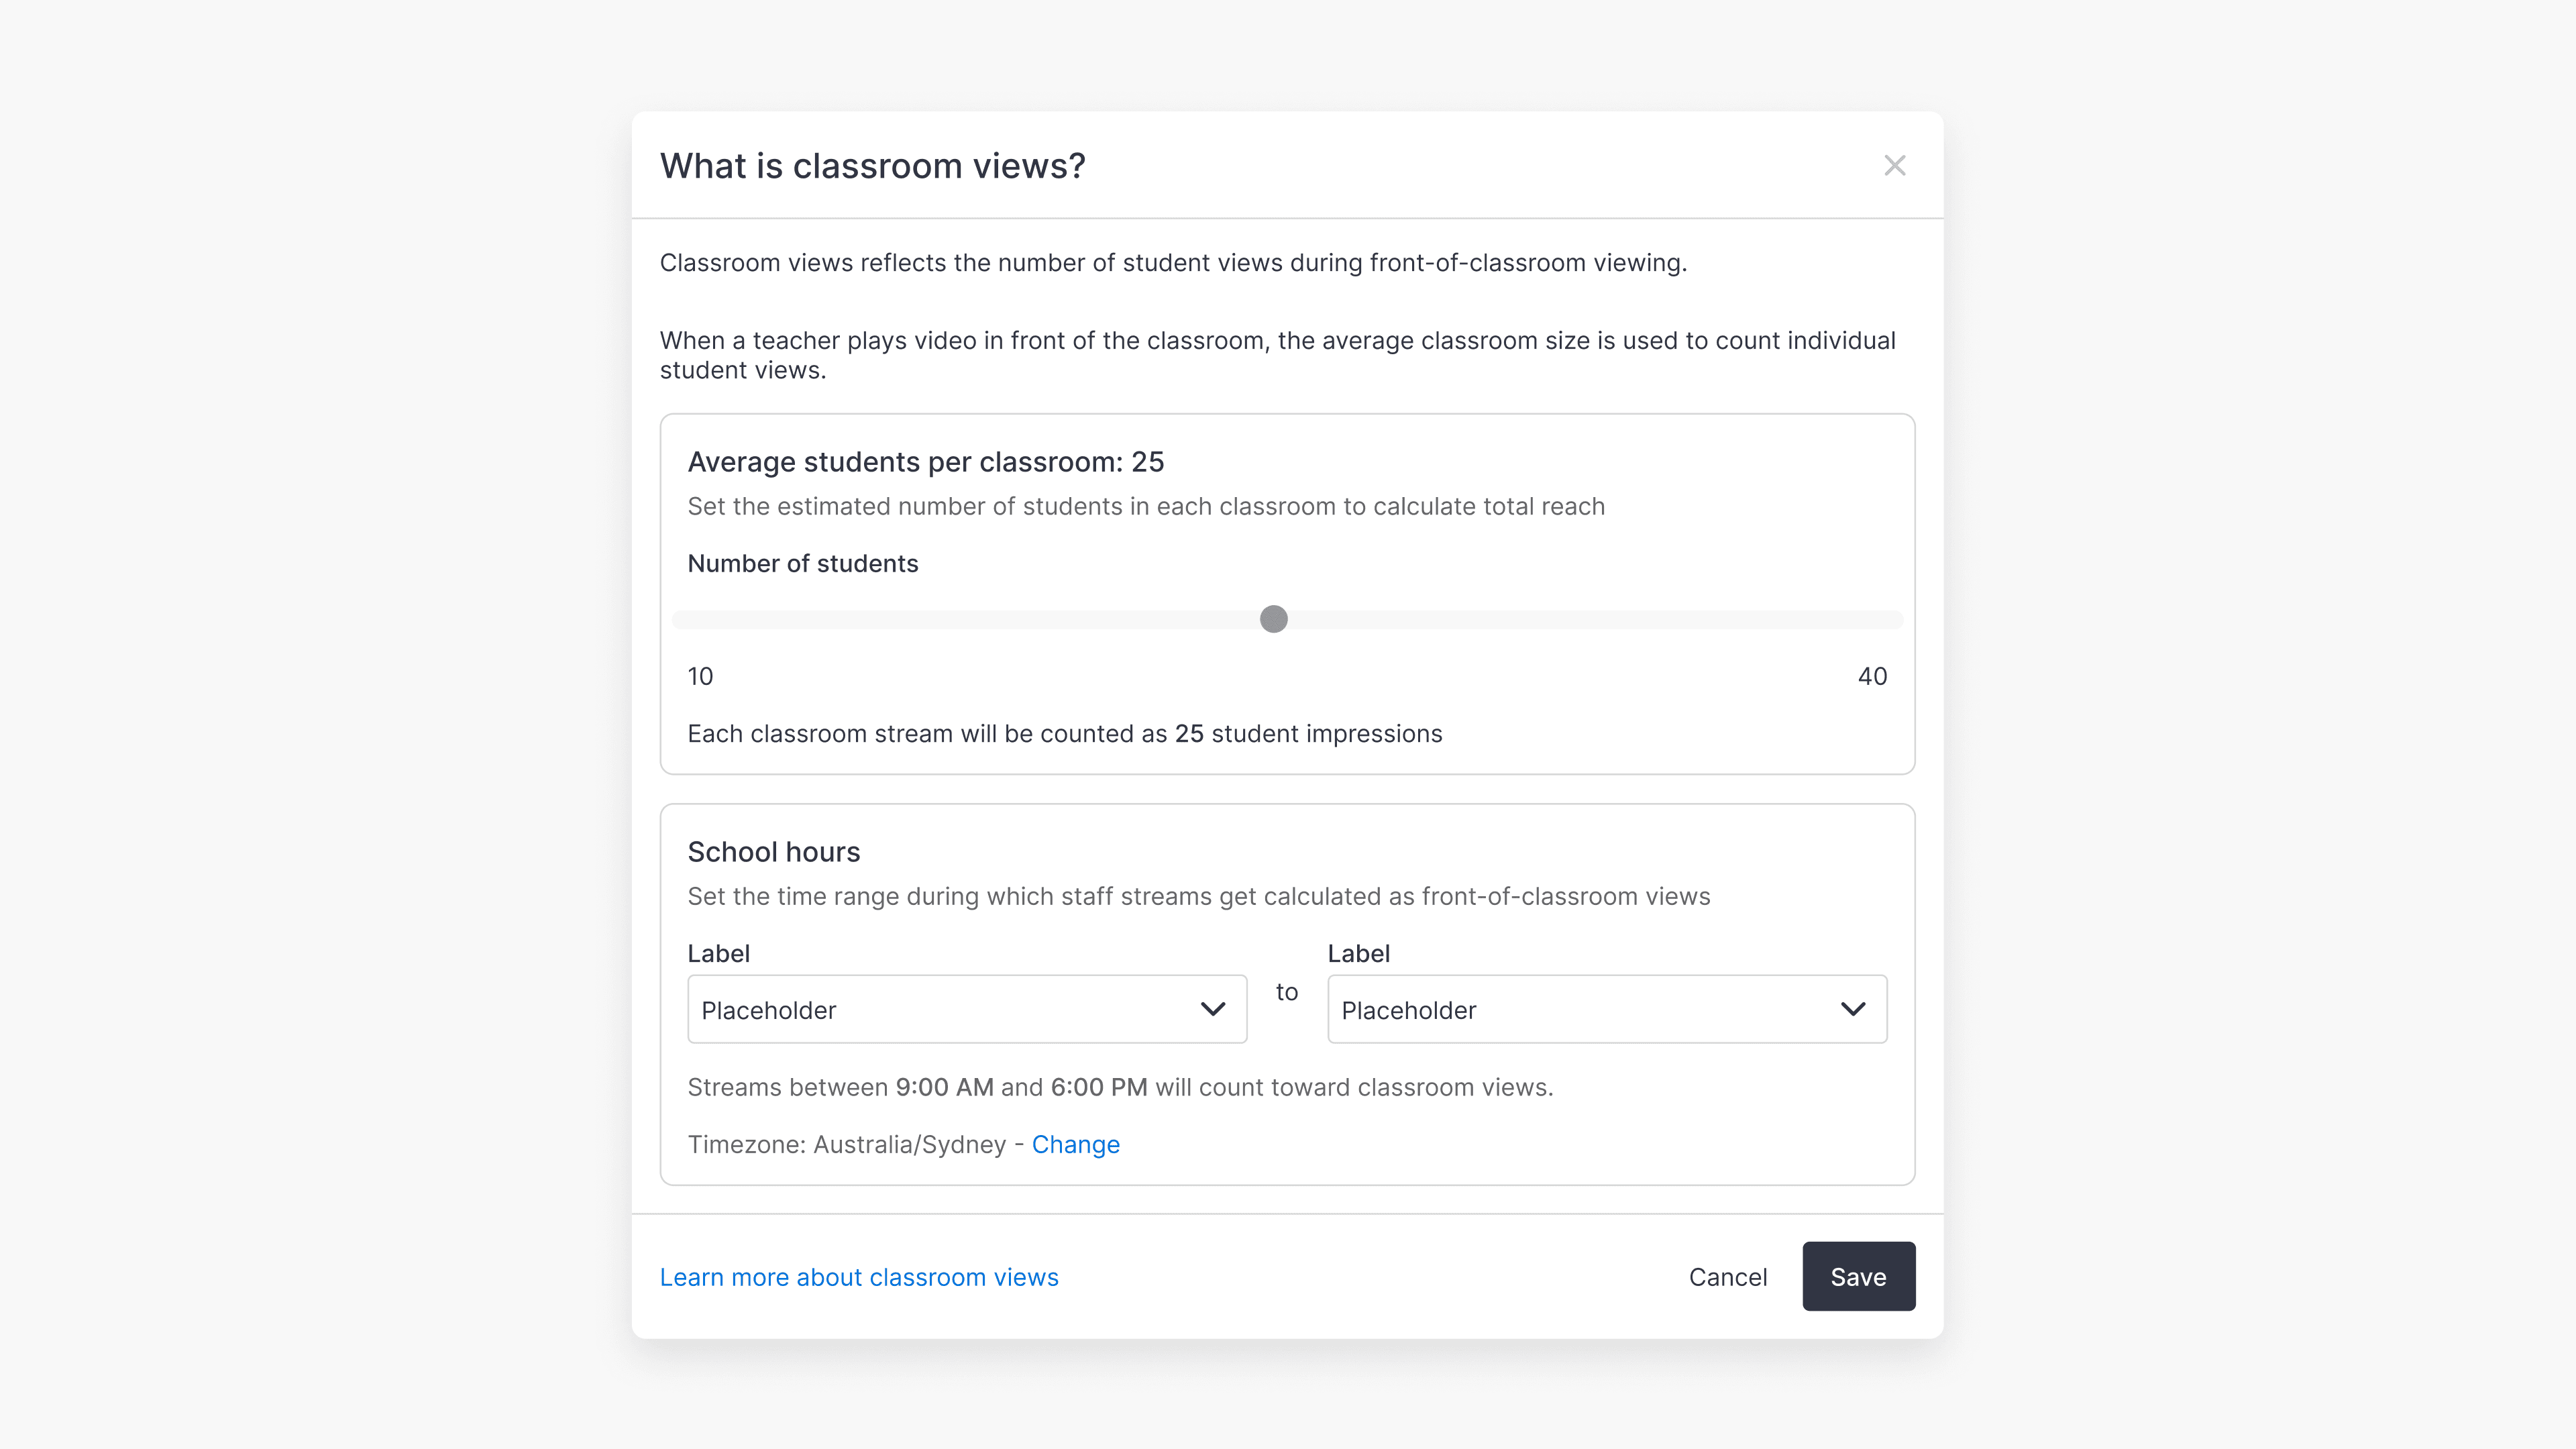
Adjusting classroom size
Classroom views metrics are calculated using an average classroom size of 25.
To adjust the average classroom size for your school, select the cog icon (⚙️) next to any Classroom views metric and adjust the number using the range slider provided.
Once saved, the analytics suite will refresh to reflect the new selection. This new classroom size will be saved for all administrators in your school.
Frequently asked questions
Get in touch
If you’re having trouble finding the right topics or videos, just reach out! Our team - 


 Andrew, Nisch, Janice, Pfreya, or any of us at ClickView - will be happy to help you get sorted.
Give feedback
Was this guide helpful?
Up Next

How to access student analytics
Summary How do I access student analytics in ClickView? Where you find student analytics depends on how the video was shared. For videos shared as a Share link, go to Shares in the left navigation. For videos assigned to an Open classroom, go to Classrooms ➡ Open classrooms. You can also access analytics for any […]