How to access shared video analytics

Summary
- Click on ‘Shares’ to access video analytics.
- Select the video or interactive video for data.
- Two main tabs: Insights and Heatmap for videos.
- Interactive videos include Students and Questions tabs.
- Insights show share status, viewers, devices, and engagement.
- Heatmap provides viewer engagement details and breakdowns.
Shared video analytics let you review how viewers engage with videos and interactive videos you have shared. From the Shares area, you can open analytics to see an overview of viewing activity, and then explore detailed engagement using the Heatmap and interactive reporting tabs.
Access analytics for a shared video
- Select Shares on the left-hand side of the screen.

- Select the video you want to view analytics for.

- On the analytics page, open the Insights and Heatmap tabs to review performance.

Insights
The Insights tab provides an overview of how the shared video is being viewed.
- Status bar: The status bar includes:
- Status: Shows whether the video can be accessed by students.
- Link: Confirms the video is shared via a share link.
- Privacy Settings: Shows who can view the video (for example, My School, Respect ratings & restrictions, or Anyone with a join PIN or link can view).

- Viewers:
- The Viewers section summarises viewer activity, including progress and number of views. To see individual viewer details, select View everyone who has watched the video.

- The Viewers section summarises viewer activity, including progress and number of views. To see individual viewer details, select View everyone who has watched the video.
- Devices:
- The Devices section highlights device usage (mobile or desktop/PC) in a chart.

- The Devices section highlights device usage (mobile or desktop/PC) in a chart.
- Amount watched:
- The Amount watched section summarises engagement and provides a link to view detailed viewing activity in the Heatmap tab.

- The Amount watched section summarises engagement and provides a link to view detailed viewing activity in the Heatmap tab.
- Anonymise Names:
- Use the Anonymise Names toggle to anonymise viewer names.

- Use the Anonymise Names toggle to anonymise viewer names.
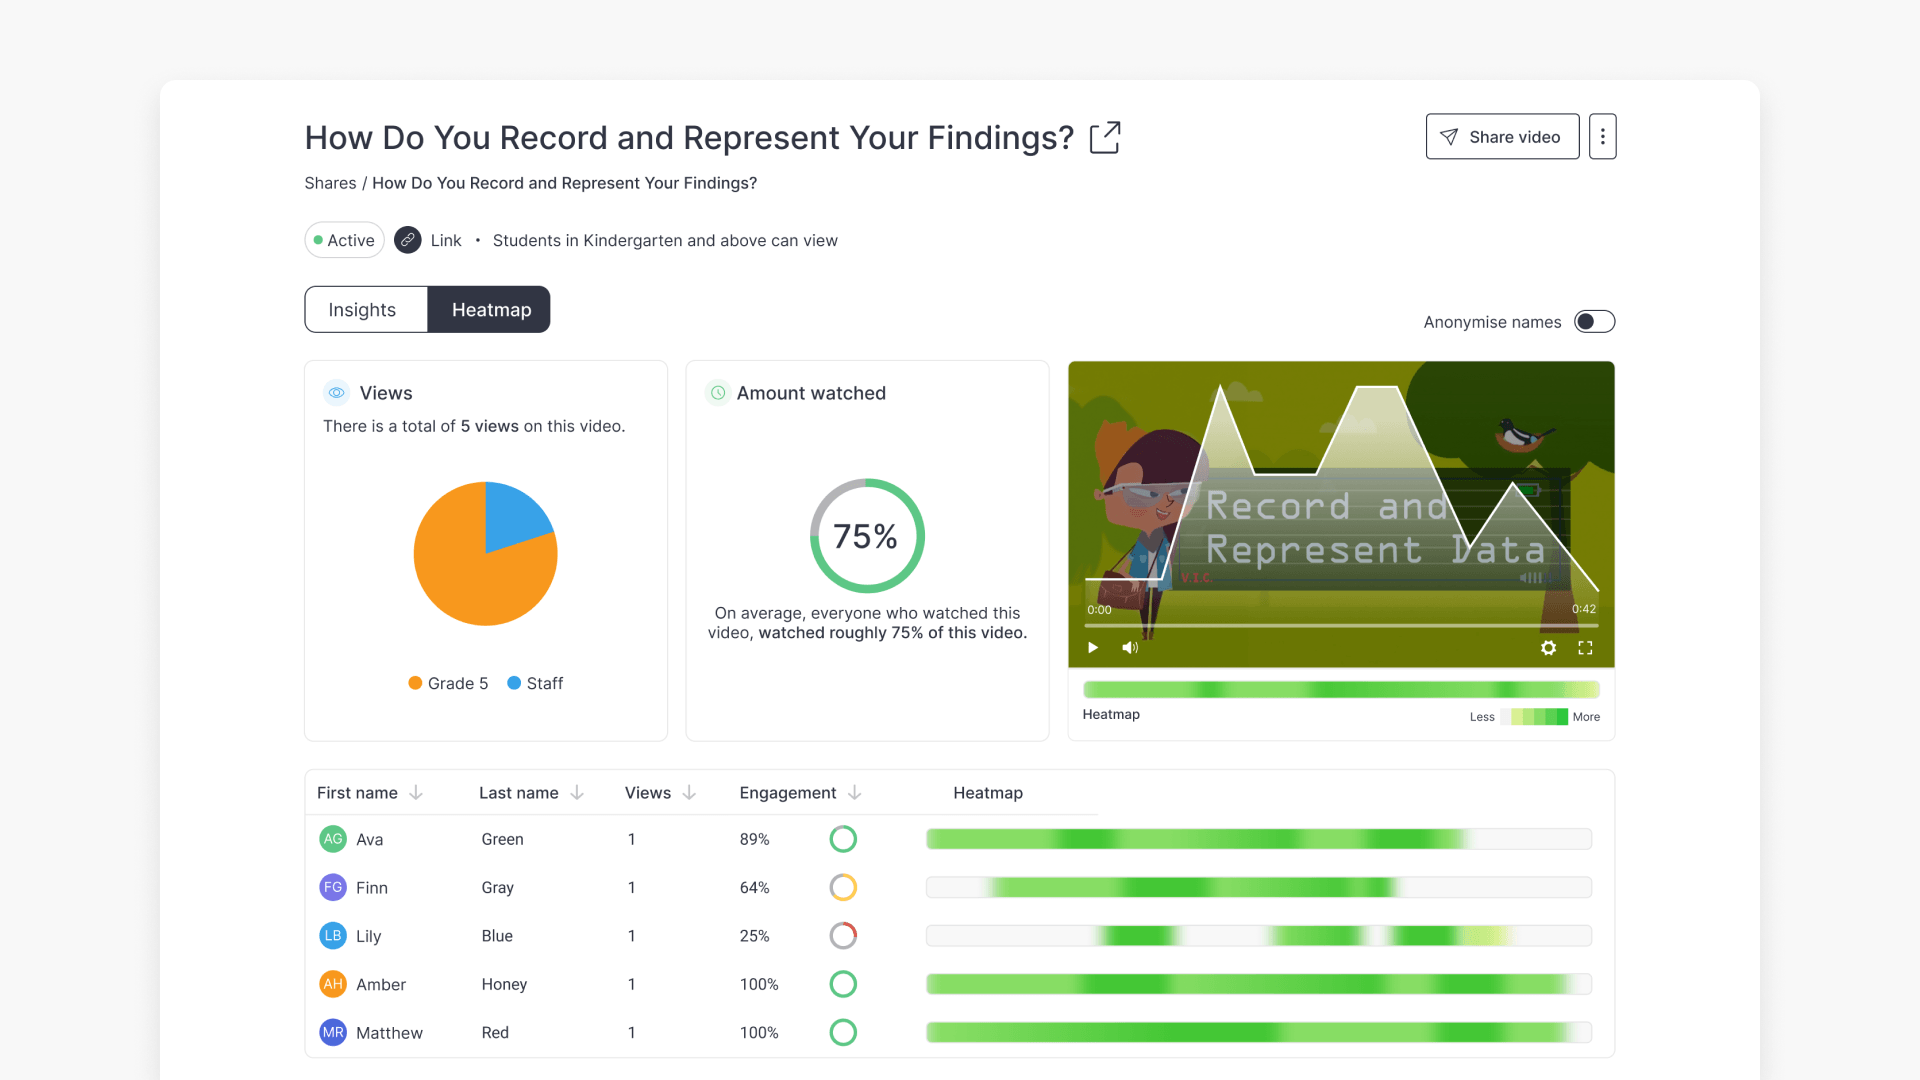
Heatmap
The Heatmap tab provides detailed insight into engagement throughout the video.
- Views graph:
- Shows year level associations of all viewers. Hover to highlight individual year levels.

- Shows year level associations of all viewers. Hover to highlight individual year levels.
- Amount watched:
- Displays average view duration and percentage watched.

- Displays average view duration and percentage watched.
- Video player with Heatmap overlay:
- Plays the video with an overlay showing higher and lower engagement across sections.

- Plays the video with an overlay showing higher and lower engagement across sections.
- Viewer list:
- Lists viewer names, number of views, and engagement percentage, with filter and sort options.

- Lists viewer names, number of views, and engagement percentage, with filter and sort options.
Access analytics for a shared interactive video
- Select Shares on the left-hand side of the screen.

- Select the interactive video you want to view analytics for.

- On the analytics page, open Insights, Students, Questions, and Heatmap to review engagement and results.


Students tab
The Students tab lists users who attempted the interactive video, including unanswered questions, total score, percentage, and the question list. You can filter the results by Not Completed, Marking required, and helping hand.

Questions tab
The Questions tab lists all questions in the interactive video with summarised results. Select a question to view details for correct and incorrect answers and student responses.


Frequently asked questions
Get in touch
If you’re having trouble finding the right topics or videos, just reach out! Our team - 


 Andrew, Nisch, Janice, Pfreya, or any of us at ClickView - will be happy to help you get sorted.
Give feedback
Was this guide helpful?
Up Next

How to access student analytics
Summary How do I access student analytics in ClickView? Where you find student analytics depends on how the video was shared. For videos shared as a Share link, go to Shares in the left navigation. For videos assigned to an Open classroom, go to Classrooms ➡ Open classrooms. You can also access analytics for any […]