Understanding School analytics in ClickView

Summary
- Sign in with an Administrator account to access School analytics.
- Use the School analytics dashboard to review insights across Logins, Video views, and Give feedback.
- Filter analytics by timeframe, student, classroom, or group using the ‘Everyone in this school’ filter.
- Explore video performance by role, year group, subject, topic, and source.
- Download analytics reports for Logins and Views as CSV files.
Access School analytics
- Sign in to ClickView with an Administrator account.

- Select your initials in the top right-hand corner of the screen, then choose Analytics from the drop-down menu.

- The Analytics dashboard opens in a new window. The left-hand menu divides Analytics into four main sections: School analytics, Logins, Video views, and Give feedback.

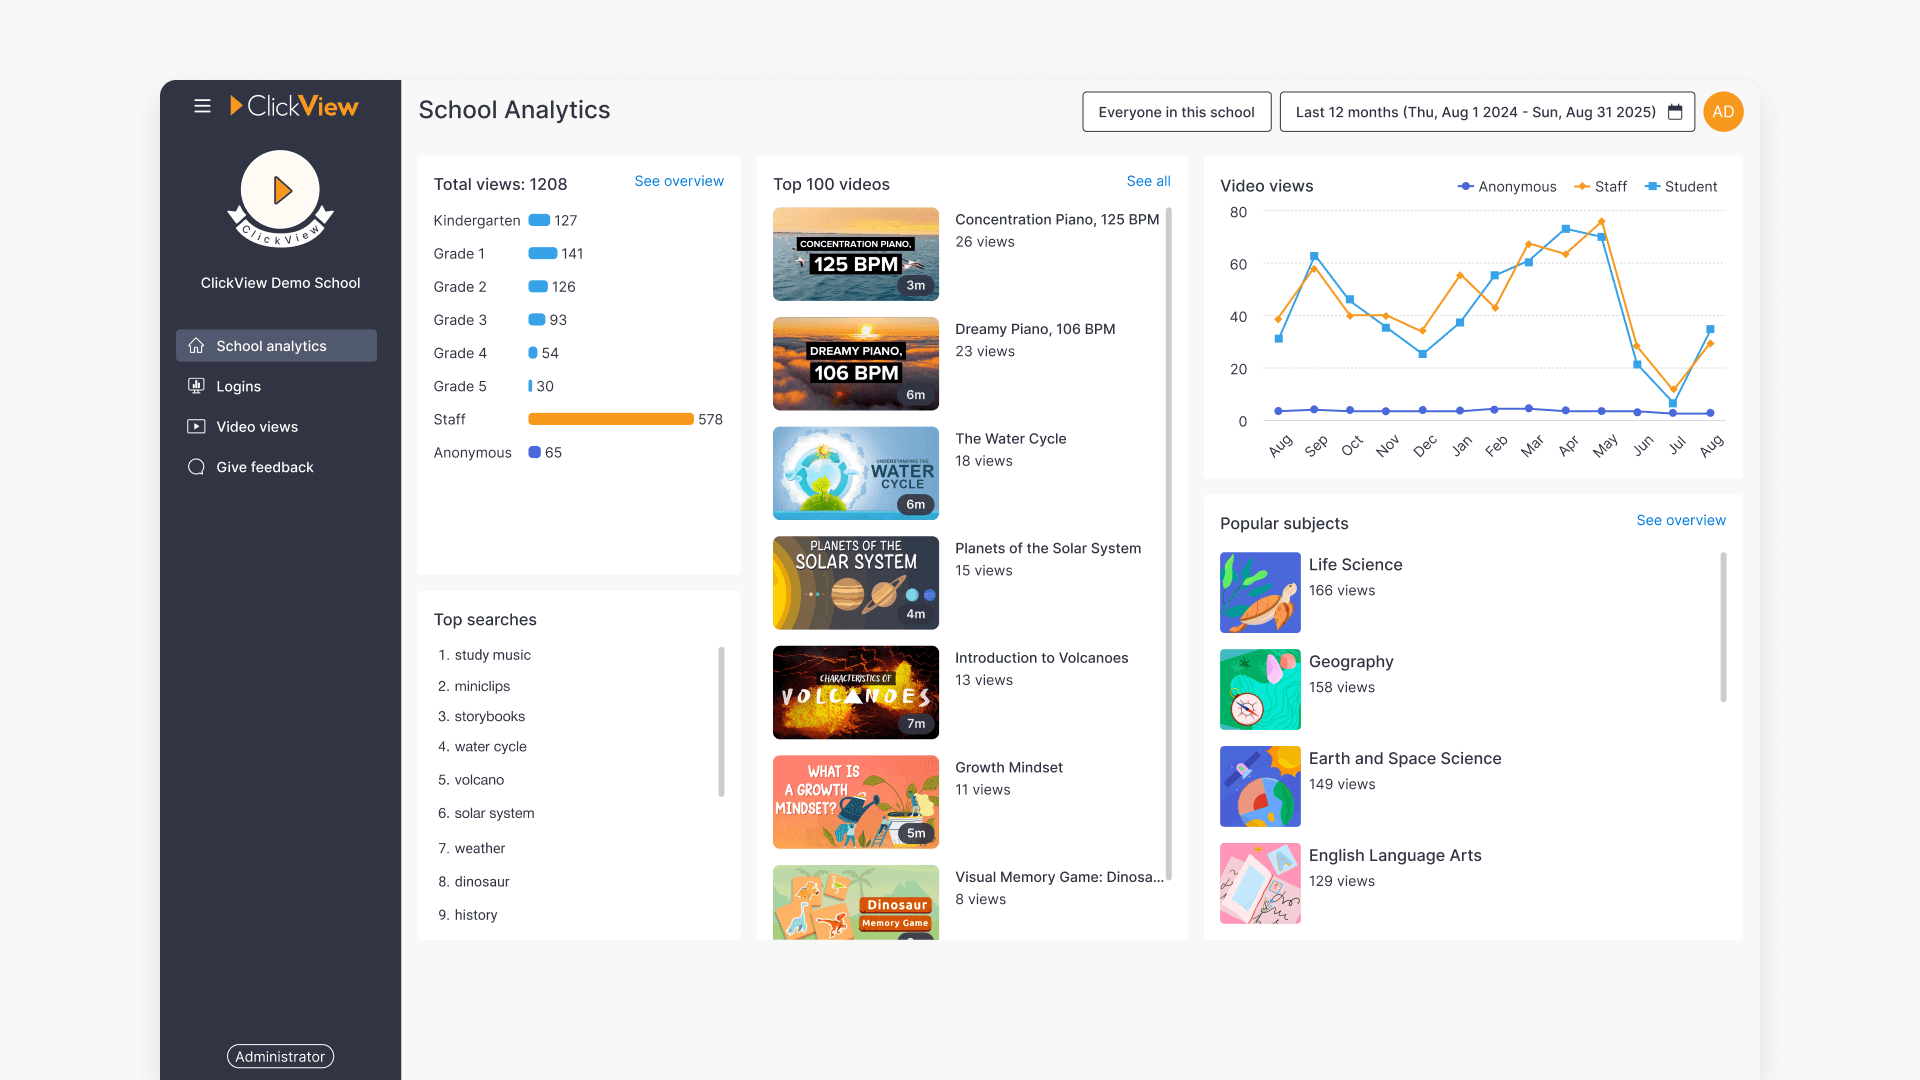
School analytics
The School analytics dashboard provides a high-level overview of how ClickView is being used across your school. It includes quick visuals for:
- Total views
- Top searches
- Top 100 videos
- Video views over time
- Popular subjects

You can filter the dashboard by:
- Timeframe, using the date selector

- Student, classroom, or group, using the Everyone in this school button


Total views
Total views are displayed as a bar chart. Selecting See overview opens the Video views report, where you can explore detailed analytics by role, year group, source, subject, and topic. More detail is provided in the Video views section in this article below.
Top searches
This section shows the most common search terms used across ClickView at your school. Selecting a search term takes you directly to the corresponding search results in ClickView.
Top 100 videos
The Top 100 videos list highlights the most played videos across your school, including both staff and student views. Selecting a video opens a detailed analytics page for that video.
Video views
The Video views chart shows how many videos have been watched during the selected timeframe. Data is displayed as a line chart and split by staff and students.
Popular subjects
This section displays the subjects most frequently viewed at your school, helping identify areas of high engagement.
Logins
The Logins section shows how often users have signed in during the selected timeframe.
- This view is useful for understanding overall platform adoption and usage patterns.

- Total sign-ins are displayed in a bar chart.

- Sign-in activity over time is shown as a line chart, split by staff and students.

Video views
The Video views section focuses specifically on video engagement. You can toggle between Overview and Top 100.
With Overview selected, you can view the same charts and filters available in School analytics, with more detailed breakdowns by:
- Role (staff or students)

- Source (where the content comes from)

- Topic

With the Top 100 tab selected, you see a ranked list of the most viewed videos for the selected timeframe.
Hover over a video and select See analytics to open a detailed analytics page. 
This page shows:
- Views over time
- Views by year group and role
- Engagement data

Under Total engagement, you can review student viewing patterns, including:
- A heatmap that highlights which parts of the video were watched most.

- Individual heatmaps for each staff member or student who watched the selected video.

Give feedback
The Give feedback section opens a dialog box where you can share feedback directly with the ClickView team. This feedback helps inform future product improvements.

Generating reports
Analytics reports are available for Logins and Video views.
To generate a report:
- select your timeframe, open the three dots menu in the top right of the screen, and choose Generate report.

- A confirmation screen will appear. Select Generate report to proceed.

Reports are downloaded in CSV format.
Frequently asked questions
Get in touch
If you’re having trouble finding the right topics or videos, just reach out! Our team - 

 Akhil, Daniel, Jalaj, or any of us at ClickView - will be happy to help you get sorted.
Give feedback
Was this guide helpful?
Up Next

How to access student analytics
Summary How do I access student analytics in ClickView? Where you find student analytics depends on how the video was shared. For videos shared as a Share link, go to Shares in the left navigation. For videos assigned to an Open classroom, go to Classrooms ➡ Open classrooms. You can also access analytics for any […]